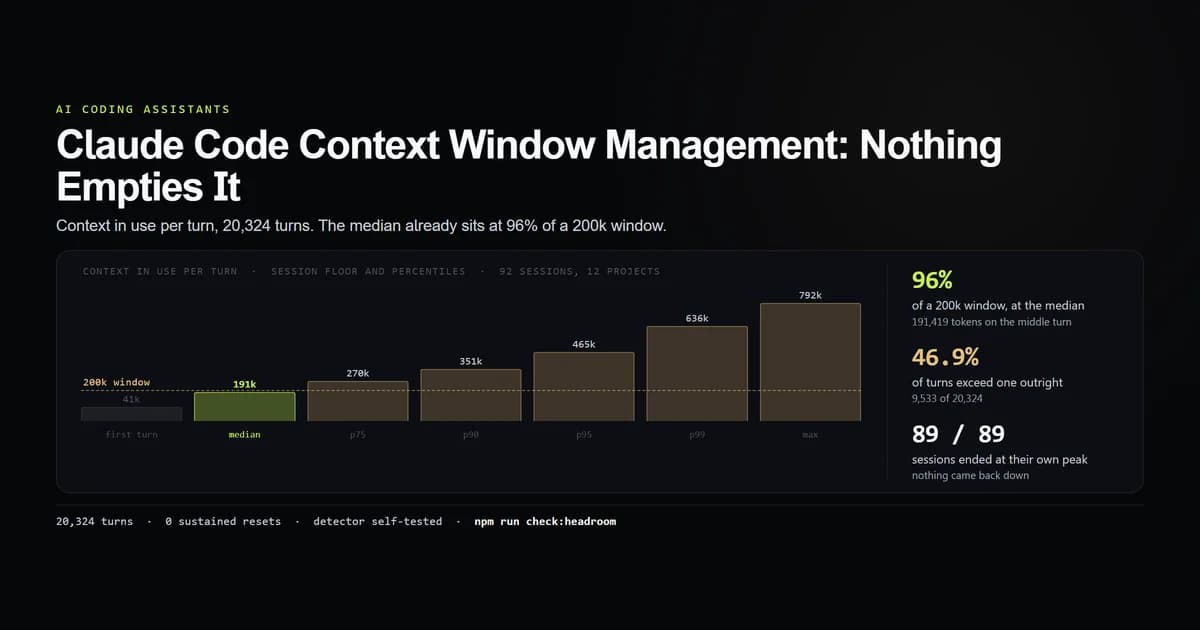
Claude code context window management is written about as if the window were something you watch and empty. We measured what actually happened to it across 20,324 turns in 92 sessions on one machine between 2026-08-06 and 2026-08-28. The median turn carried 191,419 tokens — 96% of a 200,000-token window — and 46.9% of turns carried more than a 200k window holds at all. In 89 sessions long enough to measure, context came back down zero times.
Key takeaways
- The median turn fills 96% of a standard window. Half of all turns are above 191,419 tokens; the 95th percentile is 465,209 and the largest single turn was 792,097.
- 46.9% of turns exceeded a 200k window outright — 9,533 of them. Those sessions were not running in the window most advice assumes.
- The turn record does not name your window. All 20,323 assistant turns are labelled
claude-opus-5; the[1m]suffix that identifies the window appears only in the session billing rollup. - 89 of 89 sessions ended at their own peak. Nothing gave anything back, in any session, at any point.
- Starting again is the only reduction we could observe: first turns averaged 40,668 tokens against peaks of 266,267 — a 6.5x difference, or 225,599 tokens a turn.
The short answer
The window is not a dial you turn down; it is a ratchet, and the only control this measurement could observe working is ending the session. For how a Claude Code session is assembled before any of this applies, the complete Claude Code guide covers the ground below assumed.
This article is about what to do once the window is filling. What fills it — bytes per token, the session floor, why a lockfile is the most expensive file in your repository — is measured separately in what actually fills a context window, and nothing here re-derives it.
Which window you are actually in
Start here, because most people cannot answer it and the answer changes everything downstream. A 191,419-token turn is a crisis in a 200k window and unremarkable in a 1M one.
The transcript records the model on every turn. It does not record the window:
| Where the model is named | What it says | Coverage |
|---|---|---|
| The assistant turn itself | claude-opus-5 | 20,323 turns |
| The session billing rollup | claude-opus-5[1m] | 8 sessions |
Same model, same machine, same three weeks. The [1m] suffix — the only thing in the whole corpus that names a window size — appears exclusively in the per-session cost-state record, which is a recent addition that most sessions predate. On the turn that actually used the window, the size of that window is not written down.
That is why 46.9% of turns sitting above 200,000 tokens is not, by itself, evidence of anything going wrong. Those turns were fine. They were fine because they were running in a window that holds five times what the number in most people's heads holds — and the reader who assumes 200k because that is the figure they last read will misdiagnose a healthy session as a broken one, or the reverse.
Reading headroom without guessing
Inside a live session, the /context command prints what loaded and what it weighs — one of the commands catalogued in the complete Claude Code command reference, which is the place to go for the full set rather than this article.
It answers "what is in this session, now". It cannot answer "what has this been doing all week", and by the time it says the window is nearly full, the decisions that filled it are hours old. The transcripts answer the second question, because every assistant turn stamps the context it was sent (divided across cache read, cache creation, and input tokens as detailed in Anthropic's Claude Code prompt caching guide):
{
  "type": "assistant",
  "message": {
    "usage": {
      "cache_read_input_tokens": 271696,
      "cache_creation_input_tokens": 2826,
      "input_tokens": 2
    }
  }
}
Sum those three and you have what the model was holding on that turn — 274,524 in the record above. Our internal check script does that across every session on the machine and reports the distribution rather than a single reading.
Scripted sessions are excluded, the same rule the token attribution measurement uses: 68 of the transcripts here were claude -p probes driven by earlier articles' scripts, and a probe with one turn tells you nothing about how a window fills.
What 20,324 turns look like against the limit
| Context in use | Tokens | Share of a 200k window |
|---|---|---|
| Median turn | 191,419 | 96% |
| 75th percentile | 270,051 | 135% |
| 90th percentile | 350,932 | 175% |
| 95th percentile | 465,209 | 233% |
| 99th percentile | 636,112 | 318% |
| Largest turn | 792,097 | 396% |
Read the first row again. The median turn — the ordinary, unremarkable middle of three weeks of work — sits at 96% of a standard context window. Not the peak, not a bad day. The middle.
Above it, 9,533 turns (46.9%) carried more than 200,000 tokens, 732 carried more than half a million, and none reached a million. A session that spends half its turns past the standard limit is not occasionally brushing a ceiling; it is living above one, and it can only do that because it is not in that window.
The shape matters as much as the values. The distribution has a long right tail and a high floor — there is no cluster of cheap turns to average against. Searches for claude context full generally come from the tail, but the tail here is not the problem. The floor is.
Claude Code context window management in one number
If you take one figure from this measurement, take this one:
| Measure | Mean | Median |
|---|---|---|
| Context on the first turn of a session | 40,668 | 38,688 |
| Context at the session's peak | 266,267 | 279,433 |
| Difference | 225,599 | 240,745 |
Starting a new session is a 6.5x reduction in context per turn, and it is available at any moment. Nothing else in this measurement produced a reduction of any size.
That first-turn figure is not zero, and it should not be: it is the session floor — system prompt, tool definitions, CLAUDE.md and everything it pulls in — which is the same on every session you will ever start and is measured in the CLAUDE.md cause of a slow Claude Code session. Forty thousand tokens is the price of admission. The other 225,599 is the conversation, and the conversation is the part you can put down.
The controls, and what each one removes
Four things reduce what a turn carries, and they remove different things. This is a description of what each control targets (documented in Anthropic's context window documentation); see our benchmark of the Claude Code /compact command for measured before-and-after token reduction and cache dynamics.
/clear— drops the conversation and starts again at the floor. The largest and bluntest reduction available. Loses everything the session learned, and nothing else: what clearing context actually removes measures the floor it lands on, how that floor moved across sixteen releases, and the zero bytes it frees on disk./compact— replaces the conversation with a summary of it. Designed to keep continuity while shrinking volume, at the cost of detail the summary drops. Anthropic's cost documentation notes that compaction reads the conversation it summarises, so the act of compacting is itself a large request.- A smaller floor — trimming what loads before you type. It is the only one of the four that pays on every turn of every future session, and the only one that is permanent.
--safe-modeputs an upper bound on what that trimming can win: on this machine it removed 6,140 tokens of customization by dropping every CLAUDE.md, skill, plugin and MCP server at once. - Fewer tool results in the window — the largest single additions to an agentic turn are file reads and command output. What the agent looks at is what the window carries.
A fifth control does not reduce a window so much as refuse to fill one. A session run as a coordinator has no file tools at all, so its context accumulates workers' summaries instead of their file reads — the trade agent teams prices at roughly two and a half times the money for a small job.
If the percentage is the signal you need during a run, a local Claude Code statusline can print context_window.used_percentage without adding another model turn.
The first two are episodic and the last two are structural, and the ordering people apply is usually backwards: reach for /compact when the window is full, never touch the floor. The floor is the one that compounds.
The reset that never happened
Here is the finding that surprised us, stated carefully because a null result is the easiest thing in measurement to get wrong.
A reset — compaction firing, a context being cleared — would appear inside a transcript as a fall in context volume that holds. So the check looks for one: a turn carrying less than half the running peak, in a session that had reached at least 50,000 tokens.
| Detector | Rule | Events found |
|---|---|---|
| Naive | Any fall past 50% of the running peak | 1 |
| Sustained | The same, and staying below 70% for 3 turns | 0 |
| Monotonicity | Sessions ending at their own peak | 89 of 89 |
The one naive candidate is not a reset. It is a single turn at turn 217 of a long session whose usage object is all zeroes — an errored or interrupted turn that was never billed — sitting between a turn at 274,522 and a turn at 275,777. Context did not drop; a turn failed to record. The sustained detector rejects it, correctly, and the difference between 1 and 0 is exactly what publishing the naive number alone would have claimed.
The third row is the one that settles it. In every one of the 89 sessions long enough to measure, the last turn was the largest. Context never came down anywhere, in any session, by any amount that held.
Testing the instrument before believing it
A detector that finds nothing is indistinguishable from a detector that is broken, and this site has published that mistake before: an earlier audit here found ten of its first eleven findings were defects in the instrument rather than in the subject. So the check tests itself and fails if the test fails.
npm run check:headroom
# → the reset detector did not fire on a synthetic series with a reset planted
#   in it — every null result below is a broken instrument, not a finding
That message is what prints if the self-test breaks. Two synthetic series run on every invocation: one with a reset planted in it, which both detectors must find, and one containing a single zero-usage turn, which the naive detector must flag and the sustained detector must reject. The zero result above is only reportable because those two pass.
What the zero result does not mean. It does not mean /compact does not work. Three readings survive the data and the article cannot separate them:
- The controls were never used in these sessions. The most likely explanation, and unfalsifiable from here — the transcript records no
/compactor/clearinvocation by name. The only slash command that appears anywhere in 20,324 turns is/remote-control. - Compaction fired and does not look like a fall. If a compacted session starts a new transcript, or if the post-compaction turn re-sends a full prefix, the detector would see continuity where an event occurred.
- Nothing emptied the window because nothing was asked to. Which is the same as the first reading, and is what the monotonicity row implies most directly.
There was no compaction marker in the transcript format this corpus captured, so a within-session detector was the only instrument available at publication. Update, 2026-09-15: later 2.1.258 and 2.1.270 transcripts now carry a structural compact_boundary record. Our follow-up mechanism census found two automatic events that each dropped more than 98% of active tokens. The zero here remains a detection result on the older corpus, not a current schema claim.
When to clear instead of compact
The 6.5x figure is the practical guidance and it does not need the null result to stand up. Clearing returns you to a measured 40,668 tokens; the session you are in is, on average, at 266,267.
- Clear when the task changed. The conversation is carrying research for a question you already answered, and paying for it on every turn. This is the common case and it is nearly free.
- Compact when the task is the same and long. You need the thread and cannot afford its volume. The trade is detail for continuity; the compaction mechanism and reload rules show which state returns from disk and which survives only through the summary.
- Do neither in a short session. The first ten turns of anything are cheap. Managing a window that is 20% full is work with no payoff.
- Do not clear to go faster. Clearing is a cost control. Timed across 270 turns, per-step latency is essentially flat against context size — the speed lever is step count, not window size.
- Fix the floor once instead of clearing repeatedly. Forty thousand tokens before your first word is not reduced by any control listed here; it is reduced by deleting things from the files that load at launch.
Cost follows the same ordering, for the same reason: what a turn carries is what a turn is billed for, which is the subject of where a Claude Code bill actually comes from.
Best practices for a managed window
- Find out which window you are in before tuning anything. Half the turns here would read as an emergency against the wrong limit and are unremarkable against the right one.
- Watch the median, not the peak. A 96% median is a structural condition; a 396% outlier is one bad file read.
- Clear on task boundaries, by habit, not by symptom. Waiting until it feels full means paying the full window on every turn until you notice.
- Cut the floor once and keep it cut. It is the only reduction that applies to sessions you have not started yet.
- Measure your own distribution before adopting anyone's rule of thumb, including these. The scan reads three integers per turn and needs nothing set up in advance.
Common mistakes with the context window
- Assuming a 200k window. It is the number in most documentation and half the turns here exceeded it. Symptom: a percentage that makes no sense against what the session was doing. Fix: check the billing rollup, which is the only place the window is named.
- Trusting
/contextas a management tool. It is a live gauge, and a gauge you read after the fact reports a decision already made. Symptom: discovering the window is full and having no idea which turn did it. Fix: read the distribution, then change habits rather than reacting. - Compacting a window that should be cleared. Compaction preserves a thread you have finished with, and pays to summarise it. Symptom: compacting repeatedly within one task. Fix: if you would not miss the conversation, drop it.
- Publishing a null result from an untested detector. The mistake this article nearly made. Symptom: a striking zero and no evidence the instrument can produce anything else. Fix: plant the event you are looking for and confirm the detector finds it.
What we are not claiming
⚠️ This does not measure /compact. No control was run and no before-and-after exists here. The zero is a detection result about what these sessions did, not a verdict on what the command does when invoked.
⚠️ One person, one machine, one working style. 92 sessions across 12 projects, all from the same person. A team that clears between every task would produce a completely different monotonicity row, and that would be the interesting comparison.
⚠️ Context in use is a sum of three billing fields, not a reading of the window's own counter. It is what the model was sent on that turn, which is the closest available proxy and is not the same thing as what a /context bar would show.
⚠️ The window sizes are the limits, not a claim about which was active. The corpus is grouped against 200k and 1M because those are the two sizes available; the per-turn record does not say which applied, and that absence is itself one of the findings.
Conclusion
Manage the session, not the window. On 20,324 turns the median already sat at 96% of a standard context window, almost half of all turns exceeded one outright, and in 89 sessions the context never once came back down — every one ended at its own peak. The only reduction this measurement could observe was starting again, and it was worth 225,599 tokens a turn.
Measure the headroom in your own transcripts, then check which window you are actually in — the answer is not on the turn record. For what put all of that in the window in the first place, read what actually fills a context window; for what it costs once it is there, where a Claude Code bill comes from. One line item is worth separating from the rest: the memory files split into a CLAUDE.md you pay for on every turn and an auto-memory directory that is fetched only when it looks relevant.
Frequently asked questions
How do I manage the context window in Claude Code?
How full does the Claude Code context window actually get?
How do I check which context window my session is using?
Does /compact actually reduce the context window?
What does starting a new Claude Code session reclaim?

Muhammad Kashif
Founder and editor of Devventa, covering AI coding assistants, Next.js and the modern AI development stack.