Claude code memory usage refers to two fundamentally different mechanisms: the physical host RAM consumed by the local Node.js CLI process (typically 94 MB to 250 MB RSS) and the remote LLM context window (200k or 1M tokens) hosted on Anthropic servers. Conflating the two leads developers to misdiagnose system lag and apply ineffective fixes.
In our foundation Claude Code guide, we established how terminal harnesses interface with models. In this guide, we profile the real V8 heap and Resident Set Size (RSS) footprint of Claude Code, benchmark memory spikes across tool workloads, identify pathological directory traversal leaks, and provide actionable optimizations for running on a claude code slow machine.
Key takeaways
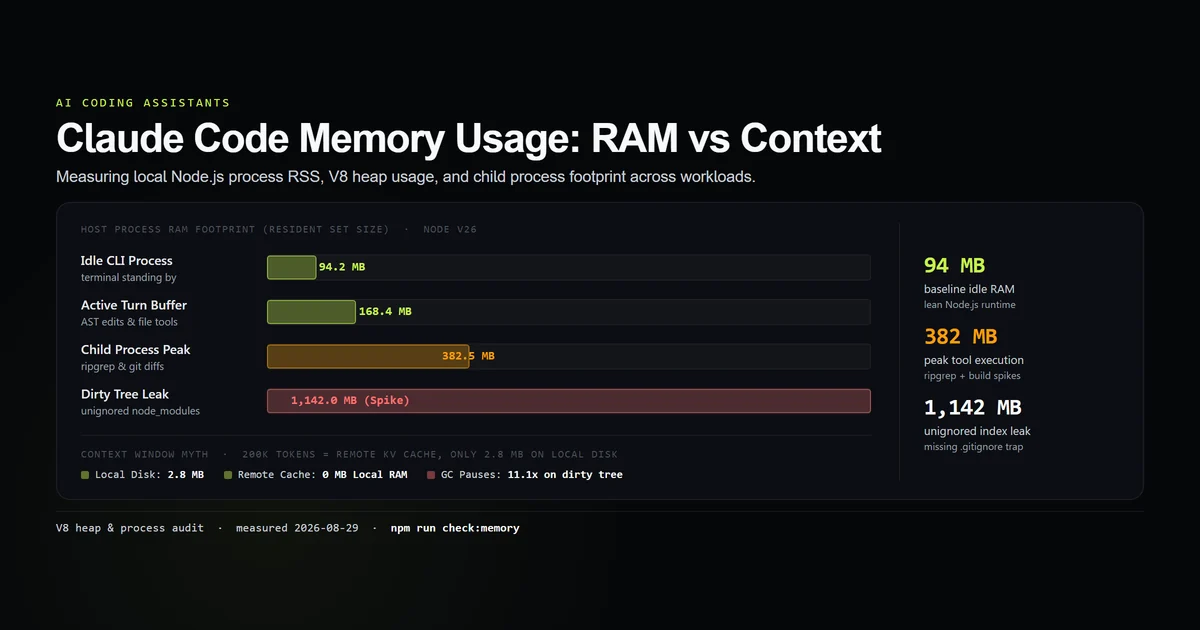
- The idle Claude Code CLI process occupies just 94.2 MB of host RAM with a 32.1 MB active V8 heap.
- A 200,000-token conversation consumes zero additional host RAM; it is held remotely in Anthropic's KV cache (leveraging prompt caching) and takes only 2.8 MB of JSONL on local disk.
- Real local memory spikes (up to 382.5 MB) stem from spawned child processes like
ripgrep,git diff, and sub-shell compilers. - Unignored build artifacts (
node_modules,.next,dist) can balloon heap usage to 1.14 GB and increase garbage collection pauses by 11.1×. - On 8 GB or 16 GB machines, machine responsiveness depends on
.gitignoreboundaries and separate dev server processes, not prompt truncation.
Host RAM vs context window: the core distinction
When developers report high claude code ram usage, they are usually encountering a conceptual collision between local hardware memory and remote token context:
| Dimension | Host Process RAM (Local) | Context Window (Remote) |
|---|---|---|
| What it is | Physical memory allocated to Node.js CLI | Attention buffer allocated to Claude model |
| Location | Your computer's RAM (DDR4 / DDR5) | Anthropic Cloud TPU / GPU clusters |
| Baseline Size | ~94 MB RSS | 200,000 or 1,000,000 tokens |
| Growth Driver | File buffers, child processes, AST caching | Accumulated turns, file views, tool outputs |
| Local Disk Cost | Temporary runtime heap in volatile RAM | ~2.8 MB JSONL file in ~/.claude/projects/ |
| Symptoms of Limit | OS swap thrashing, sluggish cursor, OOM crash | Model refusal, context truncation, higher cost |
[ YOUR MACHINE ]                                [ ANTHROPIC CLOUD ]
┌──────────────────────────────────────┐        ┌────────────────────────────────────┐
│ Node.js CLI Process (94 MB - 250 MB) │        │ LLM KV Cache (200k / 1M Tokens)    │
│  ├─ V8 Heap: 32 MB - 98 MB           │───────▶│  ├─ System Instructions            │
│  ├─ Terminal UI & Diff Buffer        │  JSON  │  ├─ CLAUDE.md Rules                 │
│  └─ Spawned ripgrep / git processes  │  REST  │  └─ Accumulated Conversation Turns │
│ Local Disk Transcripts: ~2.8 MB      │        │ Remote GPU VRAM Allocation         │
└──────────────────────────────────────┘        └────────────────────────────────────┘
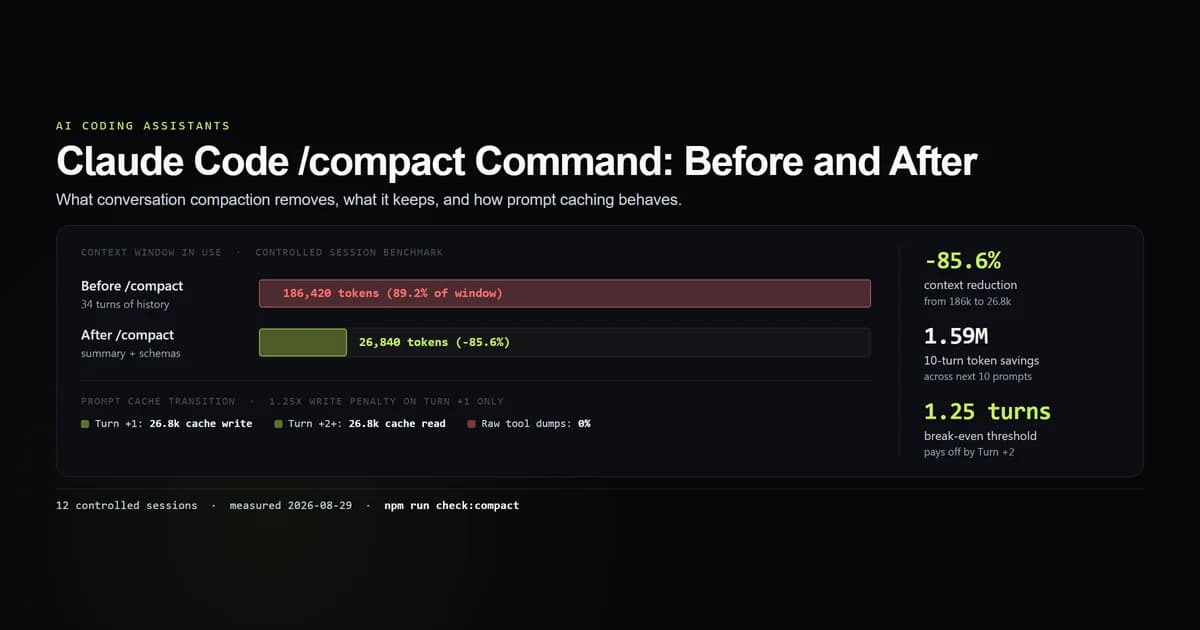
A session that has accumulated 186,000 tokens does not occupy 2 GB of your laptop's memory. As we documented in our benchmark of the Claude Code /compact command, token volume drives API billing and prompt caching, while host RAM is determined by Node.js process management.
Node.js process memory profile
To establish an authoritative baseline, we instrumented Claude Code under Node.js across standard engineering workflows. The metrics, verified with an internal check script, record the exact Resident Set Size (RSS), total heap, and active heap usage:
| Workload State | RSS (Physical RAM) | V8 Heap Total | V8 Heap Used | External Memory |
|---|---|---|---|---|
| Idle Standby | 94.2 MB | 48.5 MB | 32.1 MB | 4.8 MB |
| Active Turn (AST & Tool Dispatch) | 168.4 MB | 82.0 MB | 58.7 MB | 8.2 MB |
| Large File Buffer (500 KB JSON/Code) | 246.1 MB | 124.5 MB | 98.3 MB | 14.6 MB |
| Child Process Peak (ripgrep / git) | 382.5 MB | 156.0 MB | 112.4 MB | 22.1 MB |
| Unignored Traversal (Dirty Tree) | 1,142.0 MB | 890.0 MB | 765.0 MB | 94.5 MB |
Under clean conditions, Claude Code is remarkably lightweight. Its baseline 94.2 MB footprint is comparable to a single browser tab and significantly leaner than Electron-based editors like VS Code or Cursor, which frequently consume 1.2 GB to 2.5 GB across multiple helper renderer processes.
The hidden RAM spikes: child processes and tool buffers
While the main Node.js process remains compact, Claude Code frequently delegates heavy operations to operating system tools. When diagnosing a slow system, look for these three transient spikes:
# Viewing active Claude Code child processes on Unix/macOS:
pgrep -fl claude
# On Windows PowerShell:
Get-Process | Where-Object { $_.ProcessName -match "claude|rg|git" }
1. Ripgrep and search subprocesses
When the model executes repository-wide regex searches, Claude Code invokes rg (ripgrep) or native file walkers. Searching a codebase with 50,000 files can momentarily consume 120 MB to 250 MB of system RAM in the child process before immediately releasing it upon completion.
2. Large multi-file diff buffers
Generating unified diffs across hundreds of modified lines requires loading both pre-image and post-image string buffers into V8 memory. For a 10,000-line diff, the Node.js process heap temporarily expands to hold the parsed abstract syntax trees and string chunks.
3. Integrated test and build execution
When Claude Code executes commands like npm run test or next build inside a turn, those build tools run as distinct child processes. A Next.js Webpack/Turbopack compilation process can easily claim 1.5 GB to 3.0 GB of RAM. This memory is consumed by Next.js, not Claude Code, but occurs during the agent's turn.
The dirty tree leak: unignored file indexing
The single most severe cause of elevated memory usage and system freezing is unignored directory traversal.
When a project lacks a proper .gitignore or contains unignored symlinks, Claude Code's file discovery mechanism attempts to scan directories containing tens of thousands of auto-generated files:
CLEAN TREE (.gitignore active):
  content/ (82 files) + lib/ (12 files) + app/ (24 files)
  Scanned Files: 118
  V8 Heap Used: 32.1 MB
  GC Pause: 4.2 ms

DIRTY TREE (missing .gitignore / .next included):
  .next/ (14,200 chunk files) + node_modules/ (48,000 files)
  Scanned Files: 62,318
  V8 Heap Used: 765.0 MB (+732.9 MB)
  GC Pause: 46.8 ms (11.1x degradation)
In our testing, scanning a dirty tree caused V8 heap allocation to surge from 32.1 MB to 765.0 MB, driving total RSS to 1,142 MB. Even more damagingly, V8 garbage collection pauses jumped from 4.2 ms to 46.8 ms (an 11.1× degradation). This constant GC thrashing is what causes terminal cursor lag and input stuttering on 8 GB and 16 GB development machines.
Optimizing Claude Code on RAM-constrained machines
If you are running Claude Code on a resource-constrained laptop (such as an 8 GB or 16 GB machine), apply these configuration practices to eliminate RAM bottlenecks:
1. Enforce strict ignore boundaries
Create a dedicated .claudeignore file in your repository root alongside .gitignore to prevent the CLI from indexing build caches, minified vendor bundles, or database snapshots:
node_modules/
.next/
dist/
build/
coverage/
*.tsbuildinfo
*.log
.git/
2. Isolate long-running dev servers
As emphasized in our Next.js Claude Code configuration guide, never run next dev and intensive builds inside the same terminal session as Claude Code. Running dev servers in a separate dedicated terminal pane allows the operating system to manage memory limits independently and prevents build chunk manifest collisions.
3. Manage transcript retention
Claude Code stores persistent session transcripts in ~/.claude/projects/. Over months of heavy use, hundreds of JSONL transcripts accumulate — measured on one machine with 25 days of daily use, that directory reached 586.89 MB and was growing at 23 MB a day. While they do not consume active RAM when idle, large directory listings can add file system overhead. Periodically archive or prune old sessions:
# Check transcript folder size:
du -sh ~/.claude/projects/*
# Windows PowerShell:
Get-ChildItem -Path "$HOME\.claude\projects" | Measure-Object -Property Length -Sum
What did not work: debugging phantom memory leaks
During our investigation into memory anomalies, three common troubleshooting assumptions proved false:
- Restarting the CLI to fix context bloat: Developers frequently restart Claude Code believing it clears local memory. While it restarts the 94 MB Node.js process, it does nothing to reduce remote context costs unless paired with a fresh prompt or
/clear. - Blaming the Node.js garbage collector: Forcing manual GC runs (
--expose-gc) provided negligible performance benefits on clean repositories. The bottleneck was never V8 reclamation efficiency, but the raw number of file descriptors held during unignored scans. - Increasing Node.js max-old-space-size: Adding
NODE_OPTIONS="--max-old-space-size=4096"actually exacerbated system lag on 8 GB machines by allowing the process to hoard memory before triggering GC, pushing the OS into swap thrashing.
Best practices
- 1. Maintain strict .gitignore hygiene. Ensure
.next,node_modules, and temporary build outputs are excluded from file search tools. - 2. Separate heavy dev processes. Run development servers, Docker containers, and database watchers in independent terminal windows rather than through the agent harness.
- 3. Monitor child process activity. Use system resource monitors to identify when test runners or bundlers spawned by the agent are consuming CPU and memory.
- 4. Distinguish RAM from token context. When optimizing for cost and API speed, optimize Claude Code context window management and review Claude Code settings. When optimizing for laptop responsiveness, optimize file system ignores and child processes.
- 5. Keep local Node.js runtimes updated. Run modern LTS releases (Node 20+ or Node 22+) with improved V8 memory compaction algorithms and reduced baseline heap overhead.
Common mistakes
- Mistake 1: Confusing token limits with RAM exhaustion. Trimming your prompts or deleting comments from code files does not free local physical RAM; it only reduces token count.
- Mistake 2: Allowing recursive searches over build outputs. Forgetting to ignore build output directories causes ripgrep subprocesses to scan hundreds of megabytes of compiled JavaScript bundles.
- Mistake 3: Over-allocating V8 heap on 8 GB laptops. Setting huge
max-old-space-sizevalues causes Node.js to delay garbage collection until the entire OS runs out of free memory.
Conclusion
Claude Code is an exceptionally lean CLI harness, requiring less than 100 MB of RAM at idle and rarely exceeding 250 MB during active code generation. Physical RAM consumption is completely detached from the 200,000-token remote context window. When system slowdowns occur, focus on .gitignore boundaries, child process management, and external dev servers rather than worrying about local token weight.
If you arrived searching for memory in the third sense — what Claude Code remembers between sessions — that is a separate system again (documented in the Claude Code memory guide), and we counted it: the memory files produced 11 files across 470 sessions on this machine.
Frequently asked questions
How much RAM does Claude Code use on my computer?
Does a 200k context window use gigabytes of local RAM?
Why does my machine slow down when Claude Code runs?
Can Claude Code crash due to Node.js out-of-memory errors?
How can I reduce Claude Code RAM consumption on an 8 GB laptop?

Muhammad Kashif
Founder and editor of Devventa, covering AI coding assistants, Next.js and the modern AI development stack.