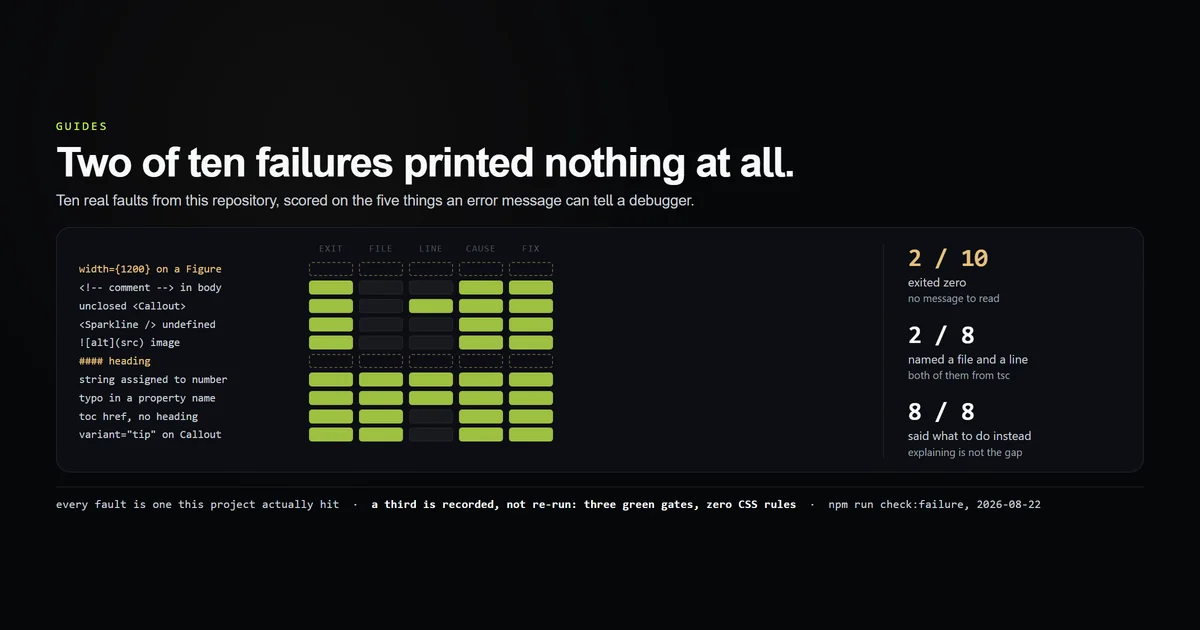
Every ai debugging tool in this category consumes the same input: the text a failure prints. So the useful question is not which one reads a stack trace best, but how often there is a stack trace. Our internal check script injects ten real failure modes this repository has actually hit, runs the tool that should catch each, and scores what came back. Two of ten exit zero — no message, no file, nothing. Only two of the eight that do fail name both a file and a line. If you are still choosing the assistant itself, the assistants pillar is the decision above this one.
Key takeaways
- Two seeded faults produced no output at all, and both are documented traps on this project: a
{expression}attribute in MDX, and a####heading. - Only 2 of 8 failing faults named a file and a line, both from
tsc. Every MDX failure gives a position inside a string with no filename attached. - All 8 named a mechanism and a fix, which is better than this category's reputation — the gap is location, not explanation.
- The best message on the board is TS2551: file, line, column, the wrong identifier and the right one, in one sentence.
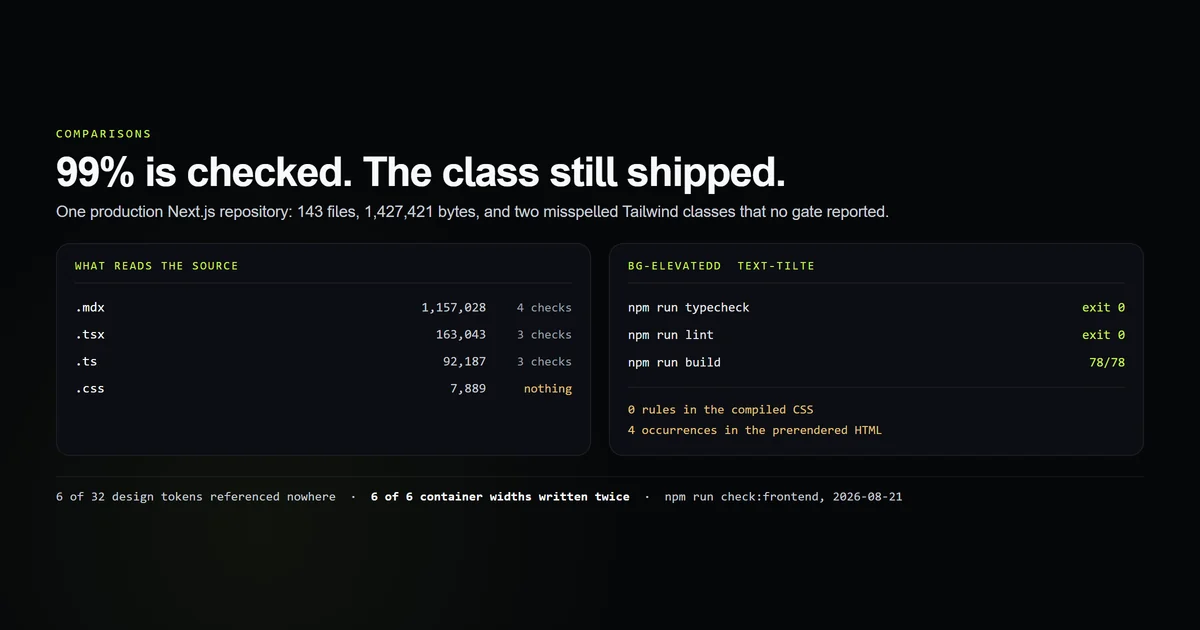
- A third fault could not be re-run at all. A misspelled Tailwind class passed typecheck, lint and build, emitted zero CSS rules, and shipped four times in the prerendered HTML.
The short answer
Pick an ai debugger for the cases where a message exists, and write a check for the cases where one does not. Every tool here is downstream of the error text; none of them can improve a failure that exits zero. The leverage on silent faults is not a better assistant, it is a script that compares two artifacts — which is the same conclusion the review-scope measurement reaches about cross-file defects.
Then judge candidates on what they do with a message that has no file in it, because on an MDX or template stack that is most of them.
npm run check:failure
# → 2 of 10 faults exit 0 — nothing to debug, because nothing failed
# → 2 of the 8 that do fail name both a file and a line
# → 8 of 8 say what to do instead
What an ai debugger actually receives
The harness writes each fault into a scratch tree outside the repository, runs the real tool, and scores the output on five things: did it exit non-zero, did it name a file, did it name a line, did it name the mechanism, did it say what to do.
| Fault | Caught at | What the message gave you |
|---|---|---|
width={1200} on a Figure | not caught | nothing |
a #### heading | not caught | nothing |
<!-- comment --> in the body | compile | cause, fix |
unclosed <Callout> | compile | cause, fix, line |
<Sparkline /> undefined | render | cause, fix |
 image | render | cause, fix |
| string assigned to number | typecheck | cause, fix, file, line |
| typo in a property name | typecheck | cause, fix, file, line |
| toc href matching no heading | project check | cause, fix, file |
variant="tip" on a Callout | project check | cause, fix, file |
Two things stand out before any of the detail. The explanation column is nearly full and the location column is nearly empty — this toolchain is good at saying what is wrong and bad at saying where. And the two rows that catch nothing are both MDX authoring faults, which is the surface every article on this site is written on.
The faults that print nothing
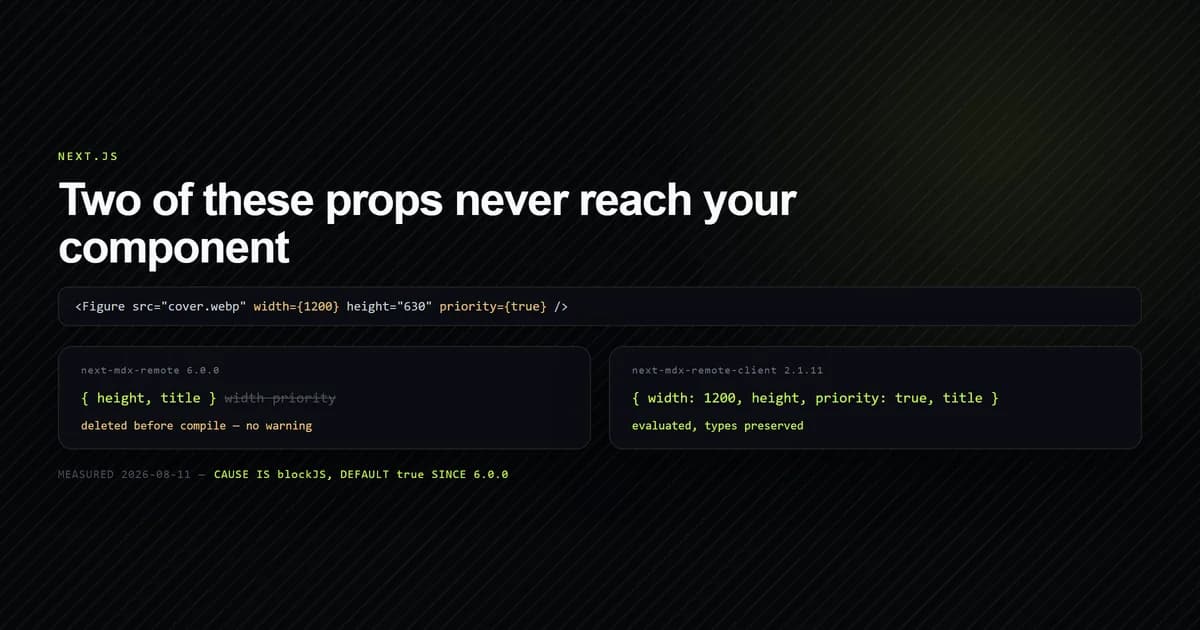
width={1200} compiles clean and renders clean. next-mdx-remote v6 ships a blockJS option defaulting to true, which deletes every expression-valued attribute before compilation. The prop is not undefined — it is absent from the object. Nothing warns. The page renders with a missing dimension and the layout shifts on load. The full mechanism, and why the RSC explanation was wrong is its own article, because this one cost real time to find.
A #### heading compiles clean too, and renders as unstyled body text. .prose-article styles ## and ### and stops there, so a fourth-level heading is not an error, it is a paragraph that was meant to be a heading. No tool in the stack has an opinion.
The third silent fault is recorded rather than re-run, because reproducing it means editing a tracked source file and rebuilding. On 2026-08-21 two misspelled utility classes — bg-elevatedd and text-tilte — were injected into components/ui/Glow.tsx:
npm run typecheck    exit 0    no output
npm run lint         exit 0    No ESLint warnings or errors
npm run build        exit 0    78/78 pages prerendered
Zero rules emitted in the compiled CSS. Four occurrences of the dead classes in the prerendered HTML. Tailwind's own class-detection reference explains exactly why: it "treats all of your source files as plain text, and doesn't attempt to actually parse your files as code in any way." A misspelled class is not a symbol, so nothing can fail to resolve it.
Only two of eight name a file and a line
Of the eight faults that do fail, six give you a mechanism without an address. The reason is structural rather than sloppy: this site renders MDX by reading a file and handing the string to MDXRemote, so the compiler genuinely does not know the filename. Its position reports are offsets into text that has no path attached.
bare comment    Unexpected character `!` (U+0021) before name … (note: to create a
                comment in MDX, use `{/* text */}`)
unclosed tag    Expected a closing tag for `<Callout>` (3:1-3:39) before the end of
                `paragraph`
undefined       Expected component `Sparkline` to be defined: you likely forgot to
                import, pass, or provide it.  It's referenced at `3:1-3:27`
markdown image  [mdx] Markdown image syntax is not supported (alt: "A terminal").
                Use <Figure src="…" alt="…" width="1200" height="630" />
Every one of those names the mechanism, and three of the four name the fix in the message itself — the bare-comment error even prints the correct {/* */} syntax and links MDX's troubleshooting guide. That is genuinely good error design. It is also, on a repository with 67 articles, a message that tells you what is wrong in one of them.
This is where an ai debugging tool earns its keep and where it does not. Given Expected component Sparkline to be defined, an assistant that can grep the content tree finds the file in one command. Given the same message with no repository access, it can only restate the error more politely.
The best error message on the board
One fault produced everything a debugger could want, in a single line:
probe.ts(3,23): error TS2551: Property 'publishedIS0' does not exist on
type 'Meta'. Did you mean 'publishedIso'?
File, line, column, the rule that fired, the identifier that is wrong, and the identifier that is right. Nothing about that needs an assistant — and that is the honest shape of this category. The failures where an ai debugger adds the least are the ones with the best messages, and the failures where it would add the most produce no message at all.
The project's own checks sit in between. Our heading-anchor check names the file and the exact broken value but gives no line:
FAIL content/guides/probe.mdx
  - toc href "#what-claude-md-does" (What CLAUDE.md does) matches no heading
That is a fault no general-purpose tool has any opinion about — rehype-slug strips the dot, so the correct anchor is #what-claudemd-does — and it is caught only because somebody wrote a twelve-line script. Of the ten faults here, two are caught exclusively by this repository's own checks, which is the strongest argument in the whole measurement for writing them.
When to reach for an ai debugger
- The message is complete and the codebase is not yours. A named file, line and mechanism in unfamiliar code is where an assistant is fastest, because the bottleneck is orientation rather than diagnosis.
- The message names a mechanism but no location. Six of eight failures here. An assistant with repository access converts "component
Sparklineis undefined" into a filename in one search; without repository access it converts it into a paraphrase. - The stack is deep and mostly vendor frames. Reading twelve frames to find the one in your code is exactly the mechanical work worth delegating.
- Not for a silent fault. With no message there is nothing to read, and an assistant asked to explain a wrong-looking page will confidently generate a cause. The move there is to diff two artifacts — compiled CSS against source, rendered HTML against expectation — which is a check, not a conversation.
- Not as the only reader of a long agent run. A single prompt on this project has produced 236 tool calls and 75 file edits with nobody watching; a failure at the end of that has a large search space and the assistant that wrote it is not a neutral party.
How to make your failures debuggable
- Give the compiler a filename. The single highest-value change available here: passing a path rather than a string would put a file into every MDX error on this site, converting six messages from "somewhere in 67 articles" to an address.
- Write a check for anything text-matched. Tailwind classes, template strings, config keys — anything matched rather than resolved has no symbol to fail on, and needs a script that compares the output to the input.
- Make the check name the file and the value.
check:anchorsprints the offending href verbatim, which is why it is actionable without a line number. A check that reports only a count is a second search problem. - Assert on the artifact, not the process. Three exit codes of zero told us nothing; grepping the compiled CSS for zero rules told us everything. The frontend surface audit is the same finding at repository scale — coverage is not verification.
- Keep a fault corpus. Ten seeded faults with recorded scores is a fixture that fails when a message gets better or worse, which is a change you otherwise notice by accident months later.
Common mistakes we made
- We built the instrument with the bug it was made to find. The first run of this harness scored both TypeScript faults as clean. Node refuses to spawn a
.cmdwithout a shell, and the refusal arrives as a null exit status with empty output, sotsc.cmdlooked exactly like a passing typecheck. Fixed by invokingnode node_modules/typescript/bin/tscdirectly, per Node's child_process documentation. A silent failure inside a silent-failure detector is not irony, it is the base rate. - Scoring MDX at the compile stage only. Two faults appeared silent because the ban on them fires at render, not compile. Adding a real render pass moved
and<Sparkline />from "not caught" to "caught", and cut the silent count from four to two. - Treating an exit code as the whole signal. Exit codes make a fault visible; they do not make it findable. Eight of ten exit non-zero here and six of those still leave you searching.
- Assuming the linter covers the CSS.
npm run lintreads the same.tsxfile the dead class lives in and has no concept of whether a class string is real. Reading a file is not checking it.
What we are not claiming
No debugger is ranked here. This measures the input every one of them consumes on one stack — Next.js 15, MDX, TypeScript, Tailwind v4. A Rails or Django project has a different silence profile and would need its own corpus.
Ten faults is a corpus, not a population. Each one is a failure this repository actually hit, which is the point, but they were chosen because they are documented rather than sampled at random.
"Names a fix" is a keyword test, not a judgement. The script asserts a declared string per fault — {/* for the comment error, closing tag for the unclosed one. It measures whether the fix is present in the text, not whether a reader would act on it correctly.
The render stage uses a stand-in component map. The real map lives in a .tsx file a plain Node script cannot import, so the harness reproduces its contract — img throws, unknown names are undefined — rather than the components themselves. The mechanism is identical; the rendered markup is not the site's.
Conclusion
Use an ai debugger where the message already names a mechanism and you need the address — that is six of the eight failures measured here, and it is real leverage. Do not reach for one when nothing failed: seed the fault, check the artifact it should have changed, and write the script that makes the silence loud. A generated unit test is the other obvious answer to a silent fault, and it runs into a different wall — only 8 of the 76 modules here can be tested without a fixture the model has to invent. Then keep the corpus. Our check script re-injects all ten and exits non-zero the moment any of them starts printing something different, which is the only way this article's numbers stay true.
Frequently asked questions
Can AI debugging tools find bugs with no error message?
What makes a good error message for an AI debugger?
Is an AI debugger better than reading the stack trace yourself?
Why did my build pass when the code is clearly broken?
How do you debug a silent failure?

Muhammad Kashif
Founder and editor of Devventa, covering AI coding assistants, Next.js and the modern AI development stack.