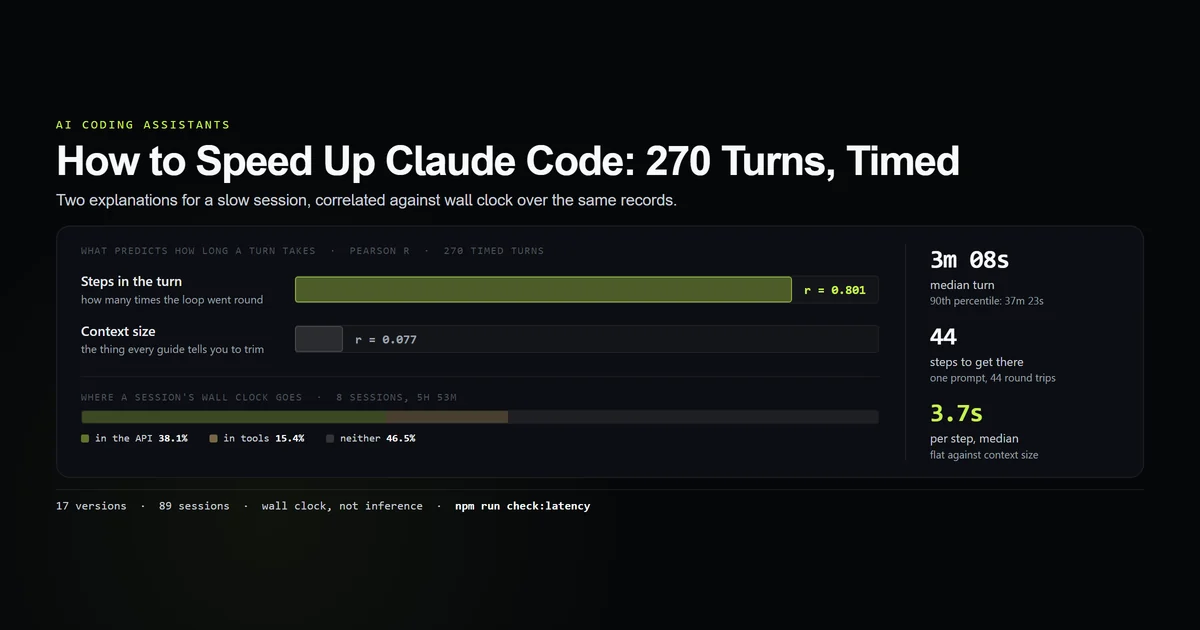
How to speed up claude code is answered almost everywhere with advice about context: trim your instruction file, clear the session, use a smaller window. We timed 270 turns across 17 versions and 89 sessions between 2026-08-06 and 2026-08-28 and compared the two candidate explanations directly. Turn duration tracks how many steps the turn takes, at r = 0.801. Per-step latency tracks the size of the context at r = 0.077 — which is to say, not at all.
Key takeaways
- A median turn takes 3m 08s and 44 steps to get there. The 90th percentile is 37m 23s; the longest single turn ran 2h 42m.
- One step costs 3.7 seconds at the median, 6.6 at the 90th percentile. That number is remarkably stable, and it is what everything else multiplies.
- Duration correlates with step count at r = 0.801. It correlates with context size, per step, at r = 0.077. Context is the cost lever; steps are the speed lever.
- Only 38.1% of session wall clock is the API. Tools are 15.4%, and 46.5% is neither — including the time you spend reading. Retries are 0.03%.
- No version is reliably faster. Per-step latency ranged 3,764ms to 6,198ms across 17 releases with no trend, and the newest sat mid-range.
The short answer
Cut steps, not tokens. A turn is a loop, one step takes about 3.7 seconds no matter how much context it carries, and the only way to finish sooner is to go round fewer times. That means scoping a request so the agent does not have to discover the task, and it does not mean trimming your instruction file — which is excellent advice for a different problem. For what a session is doing on each of those steps, the complete Claude Code guide covers the loop this article times.
There is a clock, and we said there was not
This site published an article on 2026-08-27 that said the transcripts contain no stopwatch. That was wrong, and correcting it is the reason this article can exist.
The claim came from looking in the obvious place. Assistant turns carry a usage object and no timing field, so cost is trivially measurable and duration appears not to be. durationMs turns up on system lines, we checked a few, saw tool timings, and generalised from the lines we had looked at to the file as a whole.
Enumerating every distinct subtype in the corpus instead of the ones we expected returns this:
{
  "type": "system",
  "subtype": "turn_duration",
  "durationMs": 281759,
  "messageCount": 288,
  "version": "2.1.228",
  "timestamp": "2026-08-12T10:19:24.908Z"
}
That is a stopwatch. durationMs is the wall-clock time a whole user turn took — your prompt to the agent finishing, every model round-trip and tool call inside it — and messageCount is the session's running message total at that moment, so the delta between consecutive records is how many steps that turn cost.
What a turn actually costs in time
npm run check:latency
| Turn duration | Value |
|---|---|
| 10th percentile | 2.5s |
| Median | 3m 08s |
| 75th percentile | 17m 31s |
| 90th percentile | 37m 23s |
| 99th percentile | 1h 32m |
| Longest | 2h 42m |
The spread is the story. A tenth of turns finish in under three seconds — those are questions. The median is three minutes. A tenth run longer than half an hour. "How fast is Claude Code" has no single answer because a turn is not a unit of consistent size, and any benchmark quoting one number for it is measuring the mix of work it happened to sample.
Divide through by steps and the picture stabilises immediately:
| Per turn | Median | 90th percentile |
|---|---|---|
| Steps | 44 | 476 |
| Time per step | 3.7s | 6.6s |
The median turn is 44 steps. One prompt, forty-four model-or-tool round trips. And each of those steps costs about the same 3.7 seconds whether it is step three or step three hundred.
How to speed up Claude Code, measured
Two correlations over the same 270 records answer the question directly:
| Relationship | Pearson r |
|---|---|
| Turn duration against steps in that turn | 0.801 |
| Per-step latency against session context size | 0.077 |
The first is most of the variance. The second is noise.
That is the whole finding, and it is unintuitive because the cost advice and the speed advice have the same vocabulary. Context governs what a turn costs. Step count governs what a turn takes. They feel like the same knob because both go up as a session gets long, but only one of them is on the clock, and pulling the other one is why "I trimmed my CLAUDE.md and it still feels slow" is such a common complaint.
So the levers, in order of how much time they move:
- Scope the request so the agent does not have to discover the task. A prompt that names the file, the function and the intended change removes the search steps, and search steps are steps.
- Ask for one thing. A turn that does three things takes three times as long, whatever else you optimise, because the loop runs three times as many rounds.
- Cut the tool round-trips you cause. Every file the agent must open to answer a question is a step at 3.7 seconds. Telling it where to look is faster than letting it find out.
- Do not expect a context trim to shorten anything. It is worth doing — for the bill — and on this data it does not touch per-step latency.
Context does not make a step faster
r = 0.077 is a strong claim to rest on a null, so it is worth saying exactly what was compared: each timed turn's milliseconds per step, against the mean context size of the session it happened in, over every record where both exist.
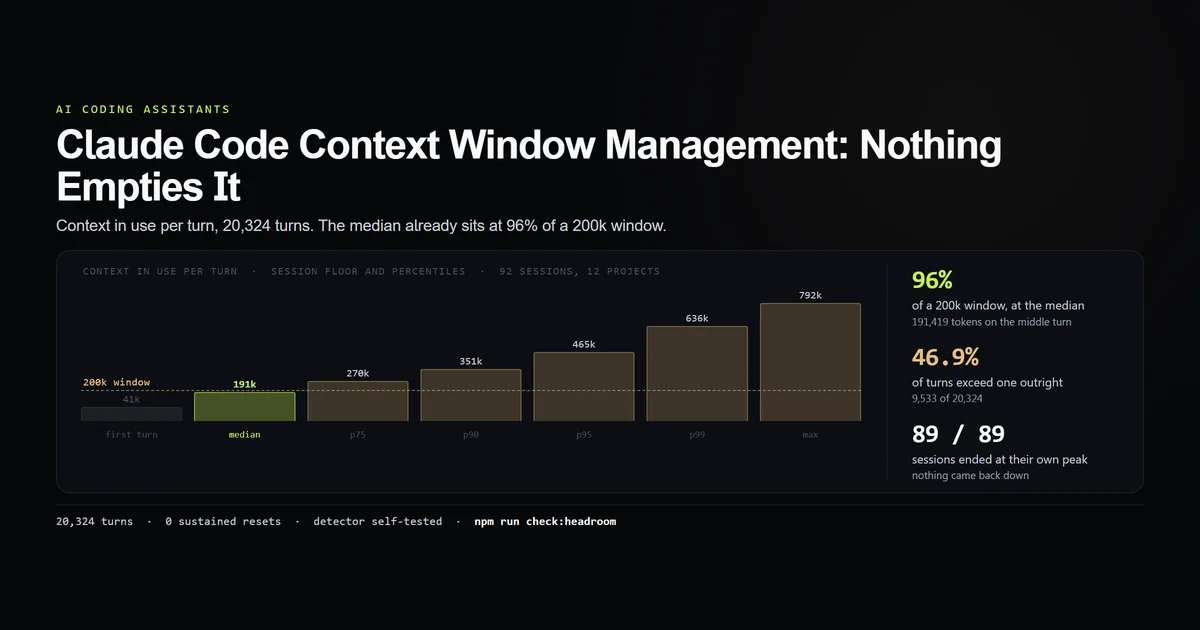
Sessions in this corpus vary enormously in context — the mean per turn runs from around 40,000 tokens to well over 300,000, and the window fills monotonically within every session, so there is real variation to detect. There is simply no relationship between that variation and how long a step takes.
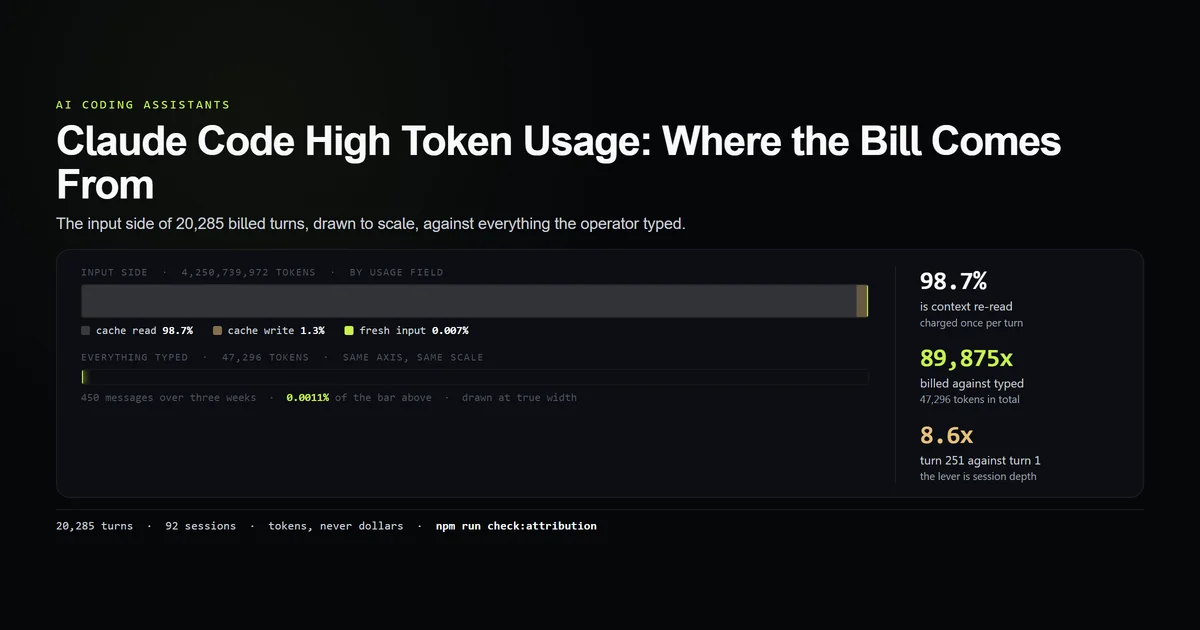
The mechanism is not mysterious once you have seen where the input side of the bill comes from: 98.7% of the context on a turn is cache reads. A cached prefix is cheap to serve as well as cheap to bill, so growing it moves the invoice a great deal and the clock very little.
This is guarded rather than asserted. The check fails if that correlation ever rises past 0.4, or if it stops being beaten by the step-count correlation by a clear margin — because a null result is the easiest kind to keep publishing after it has stopped being true.
Where the wall clock actually goes
Eight sessions in this corpus record their own time split. Across 5h 53m of elapsed time:
| Where the time went | Share |
|---|---|
| In the API | 38.1% |
| Executing tools | 15.4% |
| Neither | 46.5% |
| Retries, as a share of API time | 0.03% |
Less than half of a session is the model. Almost half is neither the API nor a tool: rendering, queueing, and the time between the agent finishing and you reading what it did and typing the next thing. That last part is not a performance problem — it is the work — but it means a session that "took two hours" was not two hours of waiting on a vendor.
Retries deserve their own line because they are the folk explanation for a slow session and they are 0.03% of API time here. Whatever is making a session feel long, it is not the client quietly re-sending failed requests.
Versions, again
| Version | Timed turns | ms per step |
|---|---|---|
| 2.1.223 | 20 | 6,056 |
| 2.1.226 | 32 | 6,198 |
| 2.1.229 | 19 | 4,487 |
| 2.1.233 | 39 | 4,770 |
| 2.1.237 | 18 | 3,764 |
| 2.1.241 | 16 | 3,887 |
| 2.1.247 | 13 | 4,089 |
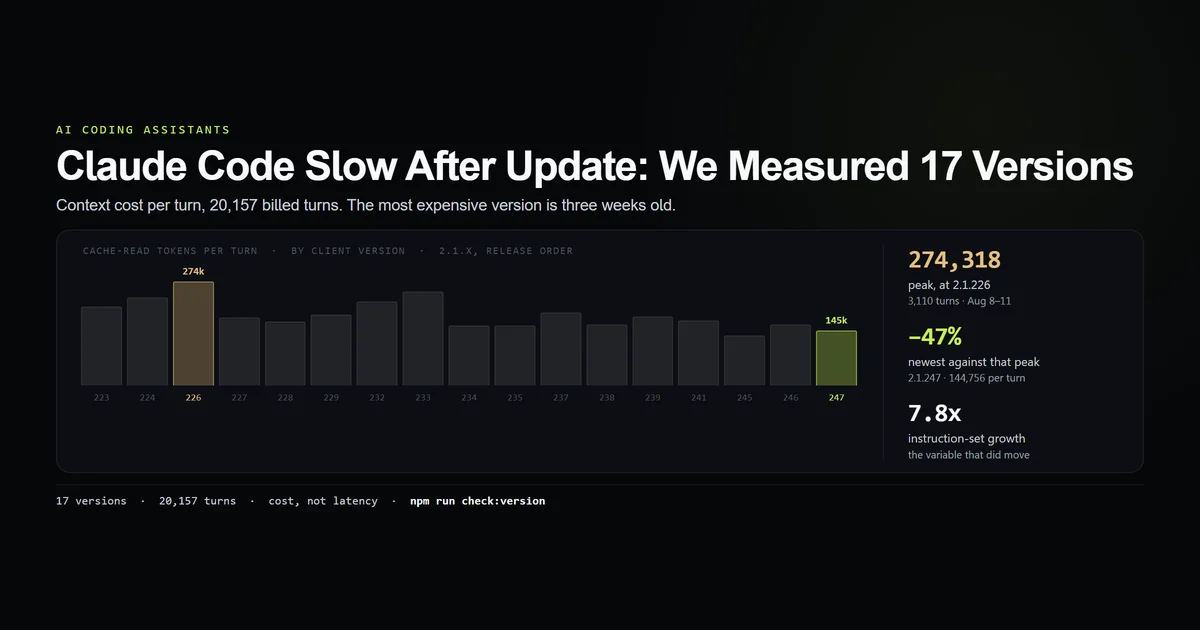
Eleven versions clear the ten-record floor; the table above shows the spread. Per-step latency runs 3,764ms to 6,198ms with no trend, and the newest measured version sits mid-range at 4,089ms.
That is the same shape we found measuring context cost per version in what actually changed when Claude Code got slow after an update — where the most expensive release was three weeks old and the newest was 47% below the peak. Two independent measurements, one of cost and one of time, and neither finds the release on the hook. If a session feels slower after an upgrade, the upgrade is still the least likely explanation available.
Run the timing yourself
node scripts/check-turn-latency.mjs --remeasure
--remeasure re-reads ~/.claude/projects and rewrites the committed fixture; without it the check reads the fixture and stays reproducible on a machine with no transcripts. It reads a duration, a message count, a version and a timestamp per record and nothing else.
Three things to get right if you write your own:
messageCountis cumulative, not per-turn. It is the session's running total at the moment the record was written. Using it directly instead of the delta makes every long session look like one enormous turn.- Divide by steps before comparing anything. Turn durations span four orders of magnitude here. Per-step latency is the only unit in which a two-second turn and a two-hour turn are commensurable.
- Check your correlation code on series with known answers. This one does, on every run: a perfectly rising series must return 1, a perfectly falling one −1, and a flat one something near zero. Both headline numbers are correlations, so an estimator bug would produce a confident wrong article rather than a visible error.
What did not work
The measurement this article needed had been publicly declared impossible — by us. The previous article in this series concluded that the transcripts contain no stopwatch, and that conclusion was reached by checking durationMs on the lines we expected to hold it and generalising from those to the file. Enumerating every subtype in the corpus rather than the anticipated ones took about a minute and returned turn_duration. The earlier article has been amended, its script header carries a dated retraction, and the retraction stays there — a corrected absence claim that leaves no trace teaches the next reader nothing.
The first per-step number was wrong by a factor of the session length. messageCount looked like a per-turn count and is a running total, so the first pass divided a three-minute turn by 288 instead of by 44 and produced a per-step latency of a few hundred milliseconds — a fast, quotable, completely fictional number. The tell was that it got smaller the longer a session ran, which is not how a per-step figure behaves. Taking the delta between consecutive records fixed it.
A version-by-version speed table nearly went in with one-record rows. Two of the seventeen versions carry a single timed turn each, and one of them reports 20,125ms per step — four times the corpus median, from a sample of one. Ranking on that would have produced a headline about a catastrophic release that is entirely an artifact of n = 1. The check marks anything below ten records as unclaimable and the table above shows only the rows that clear it.
Best practices for a faster session
- Name the file and the change. Every step the agent spends locating what you meant is 3.7 seconds you could have spent typing a path.
- One request per turn. Duration tracks steps at r = 0.801, and three tasks in one prompt is three times the steps.
- Judge speed per step, not per turn. Turn durations here span four orders of magnitude; the per-step figure is the one that is comparable week to week.
- Trim context for the bill, not for the clock. Both are worth doing and they are different jobs; see what actually fills the window for the cost side.
- Time it before you change anything. The measurement is already on your disk and takes a minute, and half of what feels slow turns out to be the half of wall clock that is not the model.
Common mistakes chasing speed
- Trimming context to go faster. Tempting because it is the advice everywhere and it does reduce something real. Symptom: a leaner setup that feels exactly as slow. Fix: count steps instead.
- Reading one long turn as a performance problem. A 40-minute turn is usually a 500-step turn doing what it was asked. Symptom: filing a bug about a session that was working. Fix: divide by steps before judging.
- Blaming retries. They are the intuitive culprit and they were 0.03% of API time here. Fix: look at the time split before theorising.
- Upgrading or downgrading to fix it. Per-step latency has no trend across 17 versions, and the release is the least likely explanation for the same reason it was not the explanation for cost either.
- Quoting a per-step figure from a cumulative counter. The mistake made while writing this. Symptom: a suspiciously good number that improves as sessions get longer. Fix: take the delta.
- Confusing host machine lag with model latency. If your entire desktop or terminal cursor stutters during turns, the bottleneck is local Claude Code memory usage caused by unignored build artifacts or child process spikes, not API inference delay.
What we are not claiming
⚠️ This does not benchmark the model. Turn duration includes tool execution, file I/O, the network and whatever else the machine was doing. Nothing here isolates inference, and none of it should be read as a statement about how fast Claude is.
⚠️ 270 timed turns is a sample. They sit inside a corpus of more than twenty thousand billed turns, and the records exist for some turns and not others. We do not know what decides which turns get one, so a selection effect we cannot rule out is possible.
⚠️ One operator, one machine, one network. The 3.7-second step is this hardware and this connection. The shape — duration tracking steps, latency ignoring context — is the part we would expect to travel.
⚠️ The wall-clock split is eight sessions. It is the only source of an API-versus-tool breakdown available, it is small, and 46.5% of it is a residual rather than a measured category.
Conclusion
If Claude Code feels slow, count the steps. A median turn on this machine took 3m 08s and 44 of them, one step cost about 3.7 seconds regardless of how much context it carried, and duration tracked step count at r = 0.801 against r = 0.077 for context size. The fastest thing you can do is ask for less discovery per turn.
Run check:latency over your own transcripts, and if the number surprises you, check the time split before you change anything — less than 40% of a session here was the model at all. For the cost side of the same loop, read where a Claude Code bill comes from; for the window it fills while doing it, what happens once it starts filling.
Frequently asked questions
How do I make Claude Code faster?
Does trimming CLAUDE.md make Claude Code faster?
How long does a Claude Code turn take?
Is my waiting time actually the model?
Does updating Claude Code make it faster?
Muhammad Kashif
Founder and editor of Devventa, covering AI coding assistants, Next.js and the modern AI development stack.