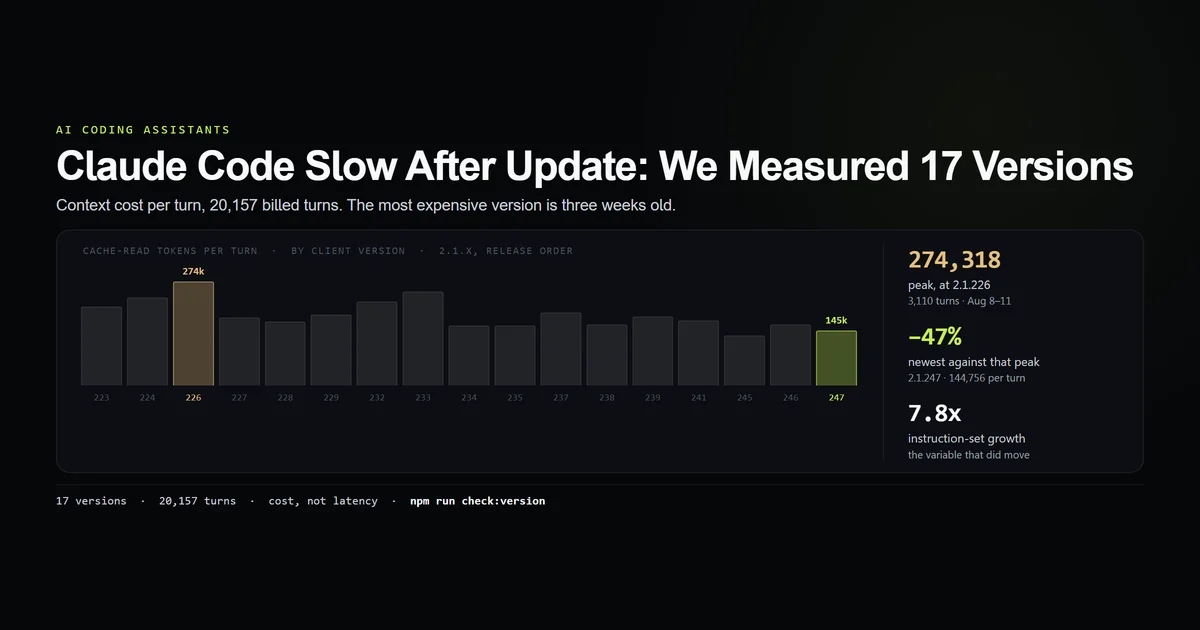
A claude code slow after update report is almost always untestable as stated: you noticed after the upgrade, and the upgrade was not the only thing that changed that week. It happens to be testable retroactively, because every assistant turn Claude Code writes to disk stamps both the version that produced it and the token counts the API billed for it. We joined those two fields across 20,157 turns, 159 session transcripts and 17 versions between 2026-08-06 and 2026-08-27. The most expensive version was three weeks old, and the newest ran 47% below it.
Key takeaways
- Context cost per turn peaked at 2.1.226 — 274,318 tokens — and the newest version measured, 2.1.247, averages 144,756, a 47% drop from the peak.
- Cost per turn does not track the version number on this machine. It moves up and down across releases with no trend in either direction.
- Over the same 21 days this project's always-loaded instruction set grew 7.8x, from 80,375 to 623,812 bytes. That is the variable that moved.
- Almost all of that growth is one file, which went from 34,126 to 569,656 bytes — 16.7x — while
CLAUDE.mditself grew 1.3x. - Every figure here is cost, not duration — assistant turns carry no clock. Correction, 2026-08-28: this takeaway originally said the transcripts contain no duration at all. They do, on
systemlines withsubtype: turn_duration, and the speed comparison is now measured in how to speed up Claude Code.
The short answer
Check what your repository did before you check what the release did. On the only corpus we can measure first-hand, the update was not the variable that moved, and the file the reader controls grew nearly eightfold in three weeks. For how a session is assembled in the first place — what loads, when, and from where — the complete Claude Code guide covers the ground this article assumes.
That is not a claim that no Claude Code release has ever regressed. It is a claim about which explanation to test first, and about the fact that most people never test either — they upgrade, notice a slow session, and stop there. The join below takes about a minute to run on your own machine and it settles the question with your own numbers.
Why the update gets the blame
An update is the most visible thing that changed, so it collects the blame for everything that changed alongside it. Four things move the cost of a Claude Code turn, and only one of them is the release.
- The client version. What the upgrade actually changed. Measurable here.
- The instruction set.
CLAUDE.mdand anything it pulls in, re-sent on every single turn. Grows quietly, warns never. - The conversation. Every turn carries the whole prior conversation, so cost rises within a session regardless of version — attributed field by field here, where 98.7% of the input side turned out to be context being re-read.
- The work itself. A day of large file reads costs more per turn than a day of small edits, and that has nothing to do with either the tool or the repository.
The third and fourth confound any before-and-after comparison done by memory, which is why "it got slow after the update" resists casual testing. The join fixes the third and fourth by averaging over thousands of turns per version rather than comparing two sessions.
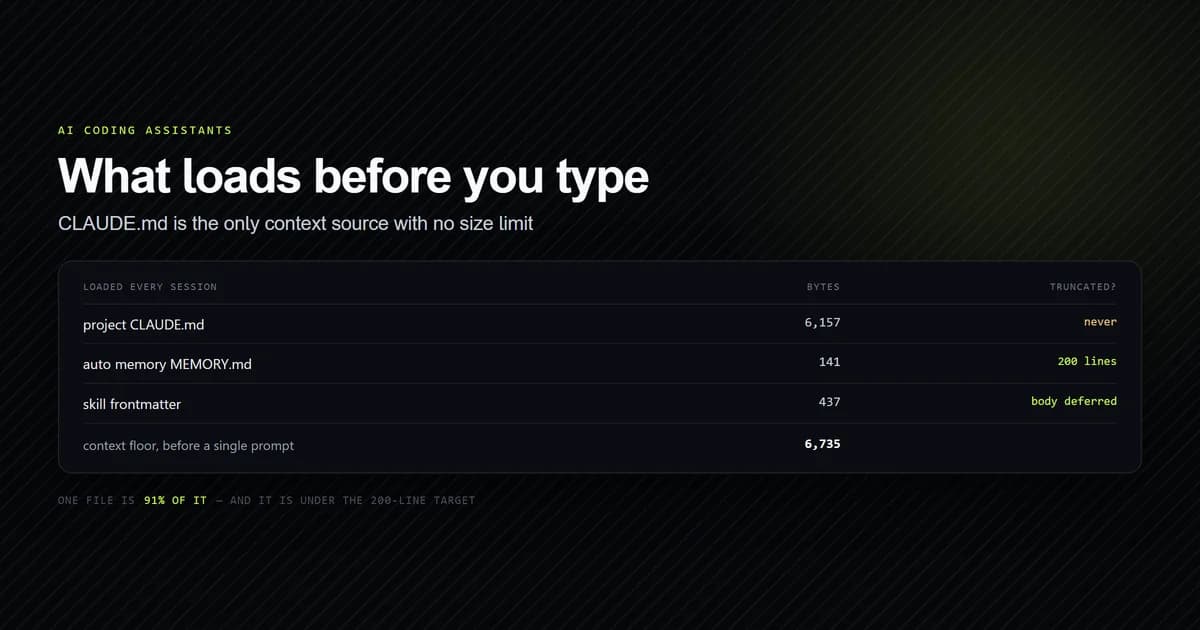
This article is only about which variable moved. For why context is the dominant cost in the first place — and why CLAUDE.md in particular is the one source with no size limit — see the CLAUDE.md cause behind a slow Claude Code session. That piece measures one tree at one moment. This one measures 17 versions over 21 days.
Joining a version to a token count
Claude Code writes every session to a JSONL file under ~/.claude/projects, one JSON object per line. Assistant turns carry two fields that make this question answerable:
{
  "type": "assistant",
  "version": "2.1.247",
  "message": {
    "usage": {
      "input_tokens": 2,
      "cache_creation_input_tokens": 325343,
      "cache_read_input_tokens": 29490,
      "output_tokens": 4
    }
  }
}
version is stamped by the client that produced the turn, so a transcript spanning an upgrade carries both versions in the same file. usage is the vendor's own billing record, not an estimate. Together they mean you can group cost by version retroactively, across every version you have ever run, with no instrumentation set up in advance.
We average cache_read_input_tokens per turn within each version. That field is the context the model was re-sent on that turn (documented in the Claude Code prompt caching documentation), and it is the dominant term in what a turn costs — the term a release could plausibly move by changing what the client packs into a request.
Seventeen versions, measured
Our internal check script reads the transcripts, groups by version, and prints the join. Versions carrying fewer than 200 turns are excluded from any claim; on this corpus all 17 clear that bar, the smallest at 215 turns.
| Version | Turns | Context per turn | Window |
|---|---|---|---|
| 2.1.223 | 853 | 209,014 | Aug 6 → Aug 7 |
| 2.1.224 | 2,207 | 233,263 | Aug 7 → Aug 8 |
| 2.1.226 | 3,110 | 274,318 | Aug 8 → Aug 11 |
| 2.1.227 | 1,258 | 178,171 | Aug 11 → Aug 12 |
| 2.1.228 | 1,570 | 169,218 | Aug 12 → Aug 13 |
| 2.1.229 | 1,958 | 187,997 | Aug 13 → Aug 14 |
| 2.1.232 | 739 | 220,837 | Aug 14 → Aug 17 |
| 2.1.233 | 2,147 | 247,386 | Aug 17 → Aug 18 |
| 2.1.234 | 499 | 158,806 | Aug 18 → Aug 19 |
| 2.1.235 | 1,254 | 159,204 | Aug 19 → Aug 20 |
| 2.1.237 | 1,291 | 192,725 | Aug 20 → Aug 21 |
| 2.1.238 | 231 | 160,699 | Aug 22 |
| 2.1.239 | 719 | 181,130 | Aug 22 → Aug 23 |
| 2.1.241 | 784 | 172,460 | Aug 24 → Aug 25 |
| 2.1.245 | 306 | 131,413 | Aug 25 → Aug 26 |
| 2.1.246 | 215 | 160,026 | Aug 26 → Aug 27 |
| 2.1.247 | 1,016 | 144,756 | Aug 27 |
Read down the right-hand column and there is no trend. The series rises to a peak in the second week, falls, rises again on 2.1.233, then settles into a lower band for the last ten days. It is noise around a wandering mean, not a staircase.
The most expensive version was not the newest
The peak is 2.1.226 at 274,318 tokens per turn, measured over 3,110 turns — the largest sample in the set, so it is not a small-n artifact. The cheapest is 2.1.245 at 131,413. The newest version measured, 2.1.247, sits at 144,756 — 47% below the peak.
If the release were the driver, the newest version would be the most expensive one and it is comfortably among the cheapest. Anyone who upgraded from 2.1.226 to 2.1.247 over these three weeks got a client that re-sends roughly half as much context per turn, while presumably feeling that things got worse.
The direction is the finding, and it is written into the check as a guard rather than left in prose:
npm run check:version
# → the latest version is now the most expensive one measured — the article
#   argues the opposite and must be corrected, not this threshold
That message is what the check prints if a future run inverts the result. The article fails loudly rather than aging quietly into being wrong.
What grew instead
The same script reads this repository's git history for the files loaded into every session regardless of task, and measures each one at every commit that touched it.
| File | First measured | Now | Growth | Revisions |
|---|---|---|---|---|
| Planning document | 34,126 | 569,656 | 16.7x | 35 |
| Editorial standards | 39,940 | 46,017 | 1.2x | 8 |
CLAUDE.md | 6,309 | 8,139 | 1.3x | 5 |
| Total | 80,375 | 623,812 | 7.8x | 48 |
The instruction set grew from 80,375 to 623,812 bytes in five weeks, and one file accounts for essentially all of it. Our planning document went up 16.7x across 35 commits — half a megabyte of prose that every session in this project loads before the first prompt according to Claude Code's memory hierarchy.
That file is not CLAUDE.md, which is the one everybody audits, and it grew by a factor of 1.3. The cost arrived in a file nobody thinks of as configuration, added a few hundred lines at a time by the ordinary work of the project.
Why the two curves disagree
Put the two measurements next to each other and they point at different culprits over the same 21 days.
- The vendor's variable fell. Cost per turn from 274,318 at the peak to 144,756 on the newest version — down 47%.
- The reader's variable rose. Instruction set from 80,375 to 623,812 bytes — up 680%.
A reader upgrading through that window experiences the sum, and attributes it to the only event with a version number attached. The upgrade is legible; a commit that added 12KB to a planning document is not.
This also explains why the effect feels sudden. Instruction-set growth is gradual and each session is only slightly worse than the last, so it stays below the threshold of notice until something makes you look — and an upgrade is exactly the kind of thing that makes you look.
Run the join yourself
The script is 380 lines and reads only two integers and a version string per turn. It never touches prompt or response content, and the fixture it writes records no project name and no path.
Our script's --remeasure flag re-reads ~/.claude/projects and rewrites the committed fixture. Without it the check reads the fixture, so it stays reproducible on a machine with no transcripts. --json prints the whole measurement for piping somewhere else.
For the live view rather than the historical one, /context inside a running session lists what loaded and what it weighs (see the Claude Code interactive mode reference) — one of the slash commands catalogued in the complete Claude Code command reference. It answers "what is in this session", not "what changed across versions", which is why it cannot settle the question this article is about.
Three things to get right if you write your own version:
- Group by the turn's version, not the session's. A session that spans an upgrade contains both, and attributing the whole file to one of them smears the boundary you are trying to measure.
- Set a minimum turn count. A version you ran for twenty minutes produces a mean that swings on a single large file read. We excluded anything below 200 turns; nothing on this corpus fell under it, but the guard is what makes that statement meaningful.
- Average per turn, never per session. Sessions differ enormously in length, and a total by version mostly measures how long you happened to use that version.
What did not work
The first thing we wanted to measure looked like it did not exist, and we were wrong. The article this was meant to be compared wall-clock latency across versions, because "slow" means duration to the person typing it. Assistant turns carry no clock — durationMs is not on them — so the whole article moved from speed to cost, and the warning callout above exists because that distinction is easy to lose in a sentence.
Correction, 2026-08-28. This section originally concluded that there is no stopwatch anywhere in the transcripts. There is. system lines with subtype: turn_duration stamp the wall-clock milliseconds a whole user turn took, alongside the running message count, and they appear on all 17 versions in this corpus. We looked at durationMs on the lines we expected to carry it, found the wrong shape, and generalised from the lines we had checked to the file as a whole. Everything measured in this article is still cost and every number above stands — the correction is to the claim about what else was available, not to the measurement. The timed comparison we originally set out to make is now in how to speed up Claude Code, and it agrees with this one: per-step latency has no trend across versions either.
The check failed red on its first run, and it was right. The threshold said the instruction set must have grown at least 10x or the argument was weak. The measurement returned 7.8x and the check exited 1. The number was not wrong — the threshold was. We had written 10x from the planning document's growth in isolation, then compared it against the three-file total, which two nearly-flat files drag down. The threshold was guarding a claim the article was not making.
The tempting fix was to lower it to 7 and move on. What it actually needed was to guard both figures: the combined 7.8x that the article quotes, and separately the 16.7x on the file where the growth actually lives, so that "the total is still high" cannot stay green after the real driver goes flat. Both guards were then verified to fail red on mutated input before this was published, along with the three others.
This is the second time on this site that an accepted threshold was authored from the conclusion rather than from a measurement. A check whose expected value is written to match the argument will confirm the argument.
Best practices after an update
- Measure before you downgrade. On this corpus a downgrade from the newest version would have roughly doubled context cost per turn. Rolling back on a hunch can move you toward the expensive end of the range.
- Track the size of every always-loaded file, not just
CLAUDE.md. The growth here was in a file that is not configuration and does not look like a cost. Anything the instruction set pulls in counts. - Group cost by the version stamped on the turn. It is already in your transcripts. You do not need to start collecting anything to answer this question about the past.
- Set a minimum sample per version before believing a mean. Two hundred turns is a reasonable floor; below that a single large file read moves the average.
- Say cost when you mean cost. If you file a regression report, "context per turn rose from X to Y across N turns" is actionable in a way that "it feels slower" is not.
Common mistakes after an update
- Comparing two sessions. Tempting because it is what you noticed, and it is confounded by conversation length and by what you happened to be doing. Symptom: a result that flips when you pick two different sessions. Fix: average thousands of turns per version.
- Auditing
CLAUDE.mdand stopping. It is the file the documentation names, so it gets the attention. Here it grew 1.3x while the set grew 7.8x. Fix: measure every file that loads at launch, then sort by bytes. - Reading token counts as milliseconds. Cost is on every turn and duration is not, so cost gets quietly relabelled as speed. Fix: use a real duration for a speed claim —
turn_durationrecords carry one, as the timed measurement does. - Blaming the release because it has a version number. The upgrade is the legible event in a week where several things changed. Fix: check what your own repository did over the same window before filing anything.
What we are not claiming
⚠️ This is one machine and one person. The corpus spans 12 projects, but every turn came from the same person on the same hardware. It is a first-hand measurement, not a benchmark, and your series may genuinely rise with the version number — in which case you now have the numbers to report it.
⚠️ No release is being exonerated in general. We measured 17 versions over 21 days. Regressions outside that window, or in behaviour other than context volume, are not covered by any of this.
⚠️ Turn counts are uneven, from 215 on 2.1.246 to 3,110 on 2.1.226. Every mean in the table carries its n beside it for that reason, and the peak happens to be the largest sample rather than the smallest.
⚠️ The corpus includes the sessions that wrote this article, so re-running --remeasure will return slightly different figures than the ones quoted here. The fixture is a dated snapshot; the guards are thresholds and directions, which is what keeps the check meaningful as the numbers drift.
Conclusion
If Claude Code feels more expensive after an update, measure your own repository before you roll anything back. On 20,157 billed turns across 17 versions, the newest client was 47% cheaper per turn than the three-week-old peak, while the instruction set every session loads grew 7.8x — and almost all of that in a single file that nobody would call configuration.
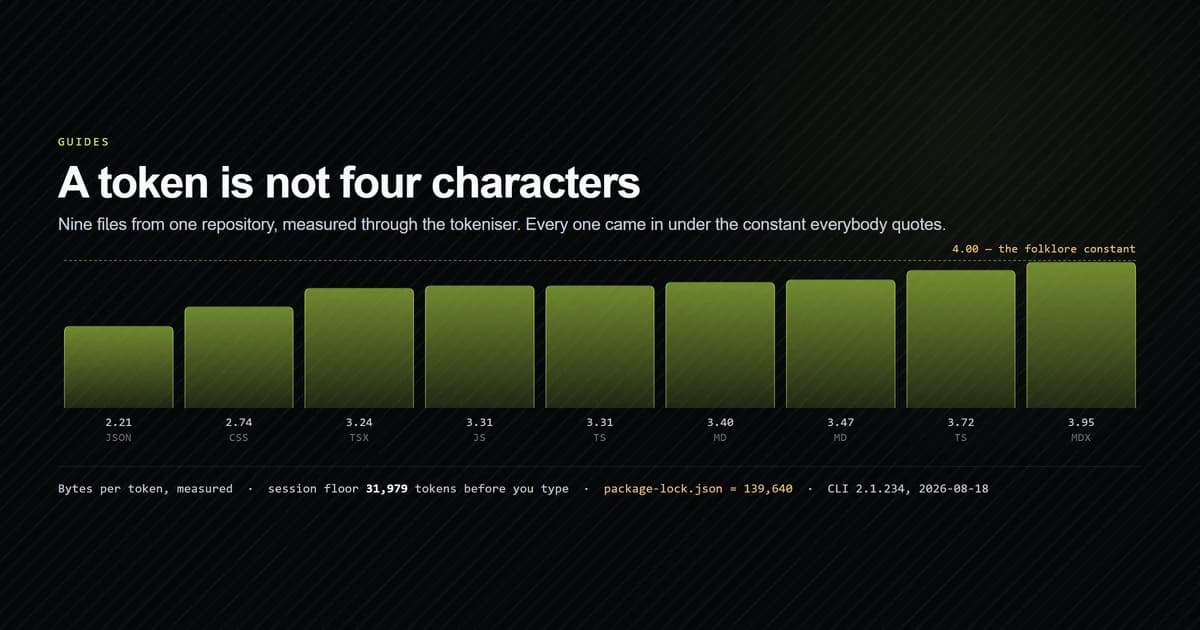
Group your own transcripts' cost by version, then go and look at what your always-loaded files weigh. If you want the mechanism behind why that weight dominates a session at all, read the CLAUDE.md cause behind a slow session next, and what actually fills a context window for what a byte of Markdown costs in tokens.
Frequently asked questions
Why is Claude Code slow after an update?
How do I check whether an update made Claude Code more expensive?
Does a bigger CLAUDE.md make Claude Code slower after an update?
Does cache_read_input_tokens measure speed?
Should I downgrade Claude Code if it feels slower?

Muhammad Kashif
Founder and editor of Devventa, covering AI coding assistants, Next.js and the modern AI development stack.