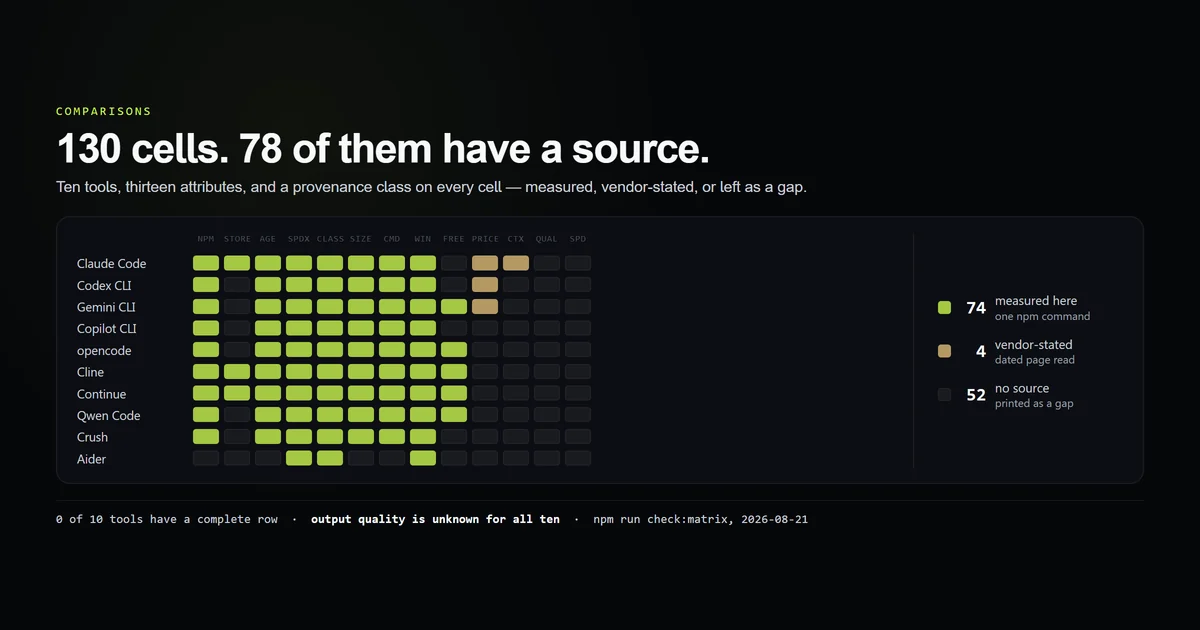
Every ai coding tools comparison is twelve tidy columns of ticks, and almost none of them are measurements. So this one carries a provenance class on every cell: measured by a command in a public repository, stated by a vendor on a dated read, or unknown. Ten tools, thirteen attributes, 130 cells — 78 carry a value and 52 are gaps, and no tool has a complete row. The gaps are the useful part. For the decision itself rather than the data, the assistants pillar is the framework this sits under.
Key takeaways
- 60.0% of the table carries a value. The other 52 cells are printed as gaps rather than filled with a tick, because no source survives a check.
- 74 of the 78 filled cells (94.9%) come from a re-runnable command, and 4 from a vendor's own page on a dated read.
- Output quality is unknown for all ten tools and stated as unknown, because measuring it needs every tool installed and a grader nobody has agreed on.
- No tool has a complete row. Claude Code leads at 10 of 13; Aider trails at 3, entirely because of which registry it ships through.
- The audit caught our own corpus contradicting itself — two scripts measuring different npm packages for the same tool, 198 weekly downloads against 78,781.
The short answer
Read the provenance, not the ticks. A comparison cell is only worth what its source is worth, and in this category the three sources available are: a public registry, a vendor's marketing page, and somebody's opinion. Only the first re-runs.
Practically that means three questions for any table you find, including this one. Where did the number come from, when was it read, and what happens when it changes? If a table cannot answer all three for a given cell, treat the cell as empty. Ours answers all three for 74 cells and answers none of them for 20, which is why those 20 are blank.
npm run check:matrix
# → 10 tools x 13 attributes = 130 cells. 78 carry a value (60.0%), 52 are a gap.
# → 74 of the 78 filled cells (94.9%) come from a command in this repository.
# → 0 of 10 tools have a complete row.
The comparison table
Split into readable groups rather than one thirteen-column wall. Every figure below is a cell in the same matrix, and every one carries the source named in the next section.
What you install and what you type. The three strings are rarely the same, which is a finding in its own right.
| Tool | Package | Command |
|---|---|---|
| Claude Code | @anthropic-ai/claude-code | claude |
| Codex CLI | @openai/codex | codex |
| Gemini CLI | @google/gemini-cli | gemini |
| Copilot CLI | @github/copilot | copilot |
| opencode | opencode-ai | opencode |
| Cline | cline | cline |
| Continue | @continuedev/cli | cn |
| Qwen Code | @qwen-code/qwen-code | qwen |
| Crush | @charmland/crush | crush |
| Aider | aider-chat (PyPI) | not published |
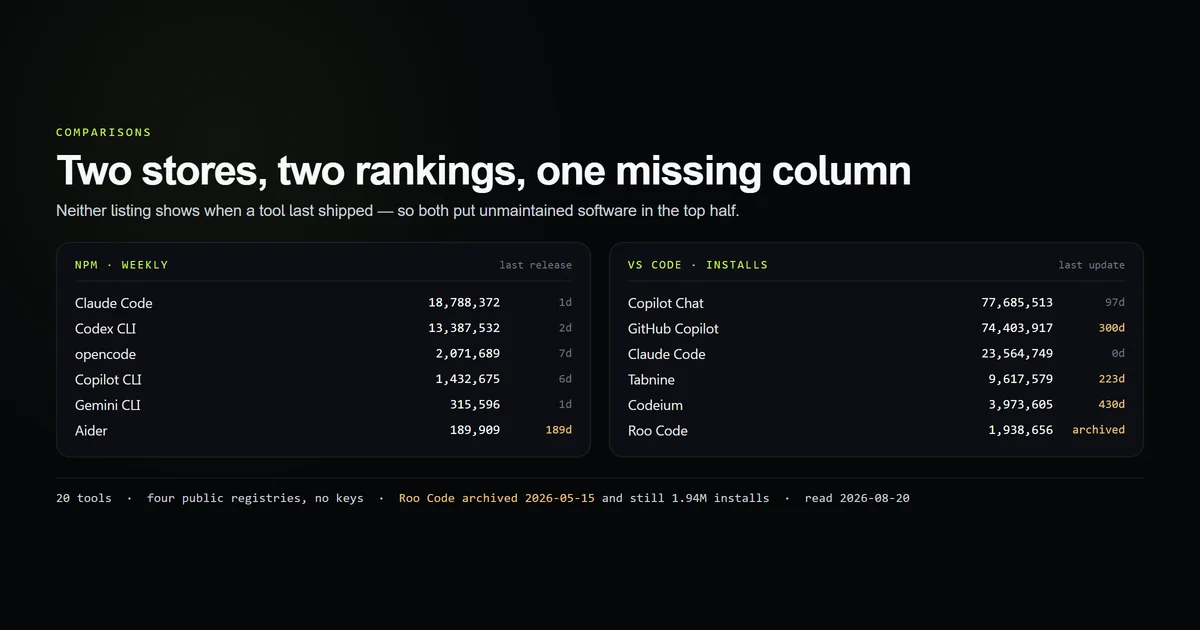
Adoption and weight, read from npm and the VS Code Marketplace on 2026-08-20, with Cline's npm row re-read on 2026-08-21.
| Tool | npm weekly | Install | Licence |
|---|---|---|---|
| Claude Code | 18,788,372 | 172.7 kB | none |
| Codex CLI | 13,387,532 | 11.7 kB | Apache-2.0 |
| opencode | 2,071,689 | 7.9 kB | MIT |
| Copilot CLI | 1,432,675 | 13.0 kB | NOASSERTION |
| Gemini CLI | 315,596 | 97.9 MB | Apache-2.0 |
| Cline | 78,781 | 46.4 kB | Apache-2.0 |
| Qwen Code | 62,365 | 94.7 MB | Apache-2.0 |
| Crush | 10,537 | 48.6 kB | NOASSERTION |
| Continue | 3,079 | 64.8 MB | Apache-2.0 |
| Aider | not on npm | 377.0 kB | Apache-2.0 |
Maintenance and the free question. Days since the last registry release, whether the project's own README documents a Windows-native install, and whether it states a free model allowance.
| Tool | Days since release | Windows | Free allowance |
|---|---|---|---|
| Claude Code | 1 | yes | not probed |
| Gemini CLI | 1 | yes | README.md:19 |
| Qwen Code | 1 | yes | none stated |
| Crush | 1 | yes | not probed |
| Codex CLI | 2 | yes | not probed |
| Copilot CLI | 6 | yes | not probed |
| opencode | 7 | yes | none stated |
| Cline | 0 | yes | none stated |
| Continue | 63 | none documented | none stated |
| Aider | 189 (PyPI) | yes | not probed |
How every cell is sourced
Each column declares three things in the script: the fixture it reads, the npm command that regenerates that fixture, and the article that published it. If any of the three stops existing, npm run check:matrix exits non-zero — the table cannot silently decay into the thing it is criticising.
| Column group | Command | Published in |
|---|---|---|
| Downloads, installs, release age | npm run check:adoption | the measured shelf |
| Licence, licence class, allowance | npm run check:free | what "free" is attached to |
| Install size, command, Windows route | npm run check:onboarding | the beginner install survey |
| Price, context window | npm run check:threeway | the three-way model comparison |
That structural rule is the whole design. A comparison table that cites nothing is unfalsifiable; one that cites an article is only as good as the article; one that cites a command anyone can run is checkable by a stranger in about a minute.
None of the underlying sources needs an account. Download counts come from npm's published download-counts API, licences from GitHub's licences endpoint, and the identifiers it returns are the SPDX licence list — which is why a NOASSERTION in the table below is a machine's answer rather than an editor's judgement.
What the audit found
| Class | Columns | Cells filled | Share of table |
|---|---|---|---|
| Measured here | 9 | 74 | 56.9% |
| Vendor-stated | 2 | 4 | 3.1% |
| Unknown | 2 | 0 | 0.0% |
Forty per cent of a thirteen-column comparison is empty once you refuse to guess. That is the number worth carrying away, and it is a floor rather than a ceiling — this site had already built nine instruments for this category before the table existed. A comparison assembled without them would score close to zero in the measured row.
Per-tool completeness is the other axis, and it says more about registries than about software:
- Claude Code, 10 of 13. Its npm package, VS Code extension and vendor rate card are all public.
- Gemini CLI, Cline and Continue, 9 each. All three publish on npm and in the marketplace.
- Codex CLI, opencode and Qwen Code, 8 each. No marketplace listing to count.
- Copilot CLI and Crush, 7 each. No marketplace listing and no first-party rate card.
- Aider, 3 of 13. It ships through PyPI, which publishes no VS Code install count and, in its JSON API, no console entry points. The tool is not more opaque than the others; its distribution channel publishes less.
Nothing scores 13. A table with no gaps in this category has been filled in rather than measured.
The two columns nobody can fill
Two attributes are declared unknown with a reason attached, and the script fails if a reason is missing. Both are columns readers want and neither is answerable from public data.
Output quality. Measuring it needs every tool installed on one machine, a fixed task set, and a grader. Only one of these ten is installed on the machine that produced this table, and the field has no agreed grader — what a benchmark score is actually evidence of covers why the obvious candidate does not settle it either.
Speed on your codebase. It depends on your repository, your network and which model you point the tool at, none of which is a property of the tool. Most of these clients will run against any of the three major vendors, so a speed column is really a model column wearing a tool's name — the parts of a slow session you can actually control sit in your repository rather than in the client.
The price column is the interesting middle case. It fills for three of ten rows — the tools whose vendor bills their default model — and the context-window column fills for one. For the other seven, price is not a missing number, it is a category error: the bill belongs to whichever key you supply. The per-byte comparison shows the same rate card moving 20.6% depending on whose tokeniser counts it, which is a further reason not to print a single figure in a cell.
When our own instruments disagreed
This is the part that did not work, and it is the reason the audit exists.
The first run of check:matrix printed Cline at 198 weekly npm downloads in one column and cline, 46.4 kB in another. Two of this site's own scripts were measuring different software under the same row label: check:adoption had been pointed at @cline/cli, the project's [EXPERIMENTAL] SDK client published once on 2026-05-07, while check:onboarding read bare cline, which is what the project's README installs.
The real figure is 78,781 weekly — 370x the published one. Article #63 had shipped the 198 the day before, and now carries a dated correction. The adoption script points at cline, only that row was re-read so every other figure in the published shelf is untouched, and check:matrix now fails when the two fixtures name different packages for the same tool.
The general lesson is not about Cline. Two instruments measuring the same thing with different constants is how a corpus starts contradicting itself, and a comparison table is where that surfaces, because it is the only artifact that puts two independent measurements in the same row. That is a reason to build one even if nobody reads it.
How to read any ai coding tools comparison
- Look for a date on the table, not on the page. A
lastModifiedin the footer says when the CMS ran. Four of the columns above move weekly. - Check whether the gaps exist. A table with no blanks has been completed rather than measured. Ours has 52.
- Treat a licence tick as a claim to verify.
NOASSERTIONfrom GitHub's own detector means source-available; two of these ten carry it, and both appear in "open source" roundups without qualification. - Ignore any quality or speed column with a value in it unless the author names the task set and the grader.
- Prefer a table you can regenerate. If the only way to update it is to email the author, it is already stale.
For the ranked version of this data rather than the audited version, the install-count shelf orders twenty tools across four registries, and the terminal-agent survey covers what actually lasts.
Common mistakes reading a comparison table
- Reading a dash as "no". Tempting because the column has ticks in it. The symptom is dismissing a tool for lacking a feature nobody measured. In this table a dash means unknown, and 52 of them do.
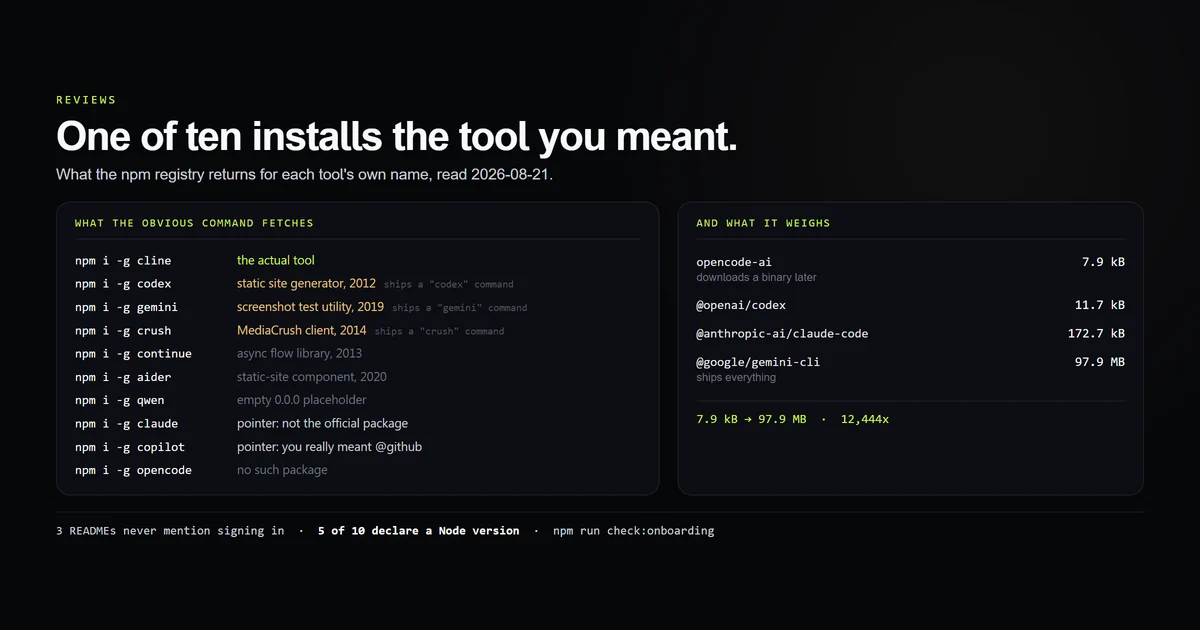
- Comparing install sizes across packaging strategies. Tempting because both are in bytes. opencode's 7.9 kB is a bootstrapper that downloads a binary; Gemini CLI's 97.9 MB ships everything. The fix is reading what the number counts.
- Assuming one row means one piece of software. We made this mistake, in public, and it was 370x wide. The fix is a check that compares your own sources against each other.
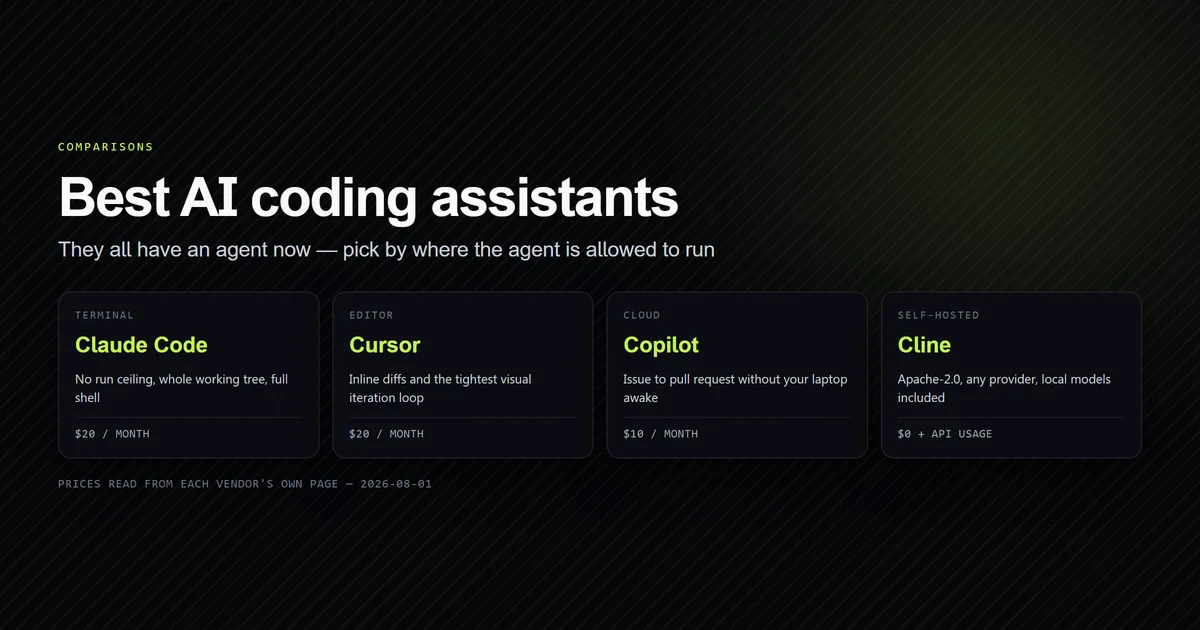
- Trusting a price cell on a bring-your-own-key tool. Tempting because every table has a pricing column. Seven of ten rows here have no price because the tool has no price.
- Taking a store ranking as a maintenance signal. The marketplace ranks archived software near the top and marks nothing; the measured shelf has an extension with 3,973,605 installs and 430 days without an update.
What we are not claiming
No tool is recommended here. This audits a table. Which of these ten to install is a decision about surface, licence and budget, and the assistants pillar is where that decision is worked through.
"Measured" means traceable, not important. The 56.9% figure counts cells produced by a command in this repository. It says nothing about whether those attributes are the ones that should decide a purchase.
The context-window column is thin on purpose. It fills for one row of ten: the tools with a first-party vendor card are three, and only one of those cards carried a captured context-window figure on the page that sets the price. That is the vendor's publishing choice showing through, and inferring the other two from a docs page elsewhere would have made a stated cell look measured.
One machine, one day. Every figure carries a read date and several move weekly. The check is the durable part, not the numbers — npm run check:matrix fails on a renamed script, a deleted article, a fixture that stops resolving, or two fixtures naming different packages for one tool.
Conclusion
Use this table for the columns that are measured and ignore it for the ones that are blank — that is the whole intended reading. If you are building your own ai coding tools comparison, the cheapest useful thing you can do is add a provenance column before you add another feature column, because it converts an unfalsifiable page into one a reader can check. Then run it against itself: ours found two of our own scripts measuring different software in the same row, on the first pass, on a table we had every reason to trust.
Frequently asked questions
What is the best AI coding tools comparison table for 2026?
Why do AI coding tool comparison tables disagree with each other?
Can you compare AI coding tools on output quality?
Which AI coding tool has the most complete public record?
How often does a comparison table like this go stale?
Muhammad Kashif
Founder and editor of Devventa, covering AI coding assistants, Next.js and the modern AI development stack.